8. DSS Review and Results
8.1 DSS Wrims DSS Perspective
Purpose
This chapter explains how to use the DSS Perspective to compare studies.
Before you start
You have DSS files or study results ready to compare.
You can switch to DSS Perspective.
Procedure
WRIMS 3 may reopen in the perspective that was active during the previous session. If it does not open in DSS Perspective, switch to that perspective first.
This workflow compares two studies by loading their DSS files.
For comparison:
one study is treated as the base;
the other is treated as the alternative.
Differences are then shown as: alternative - base
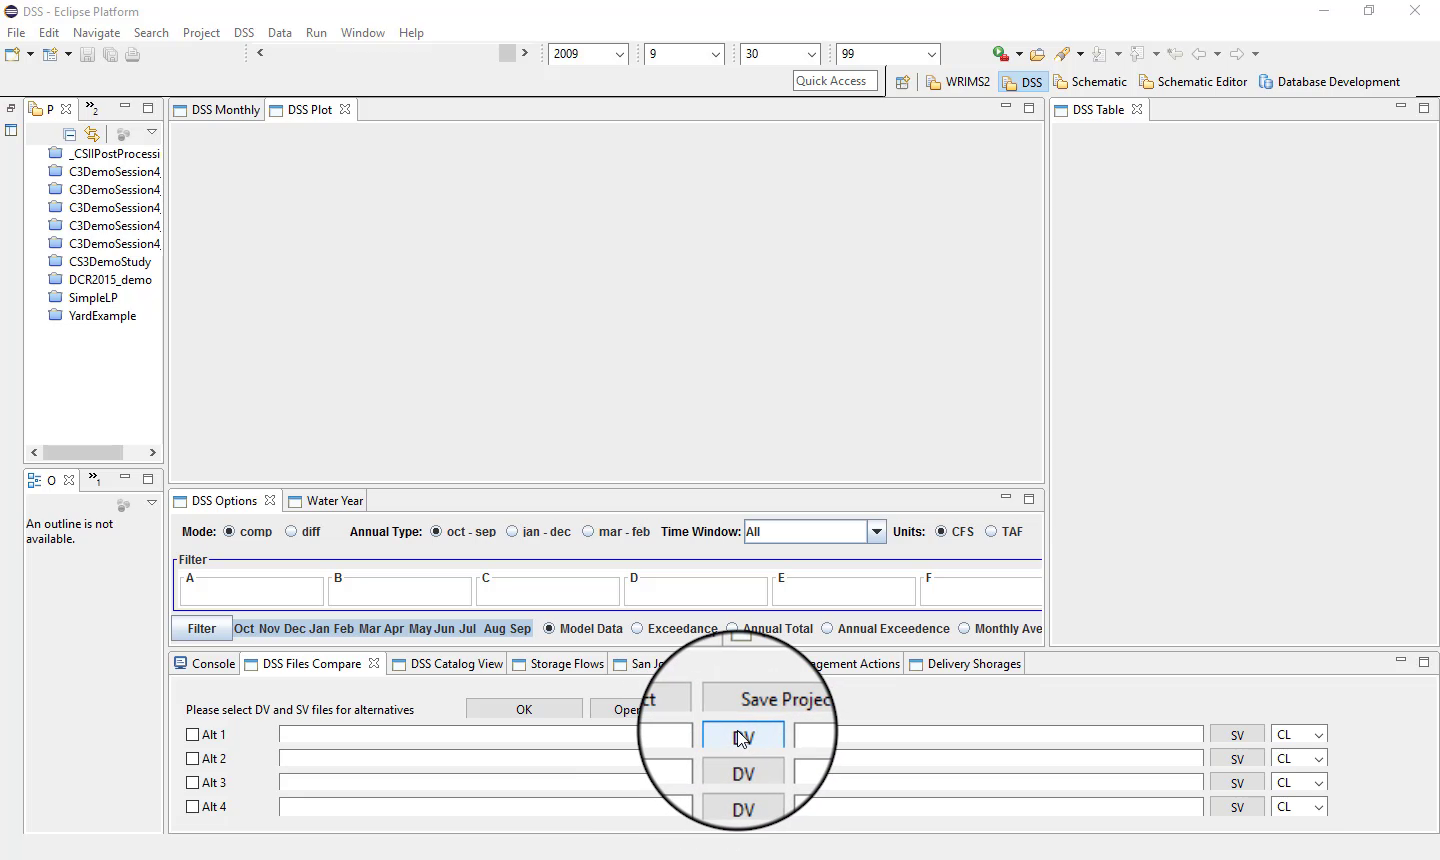
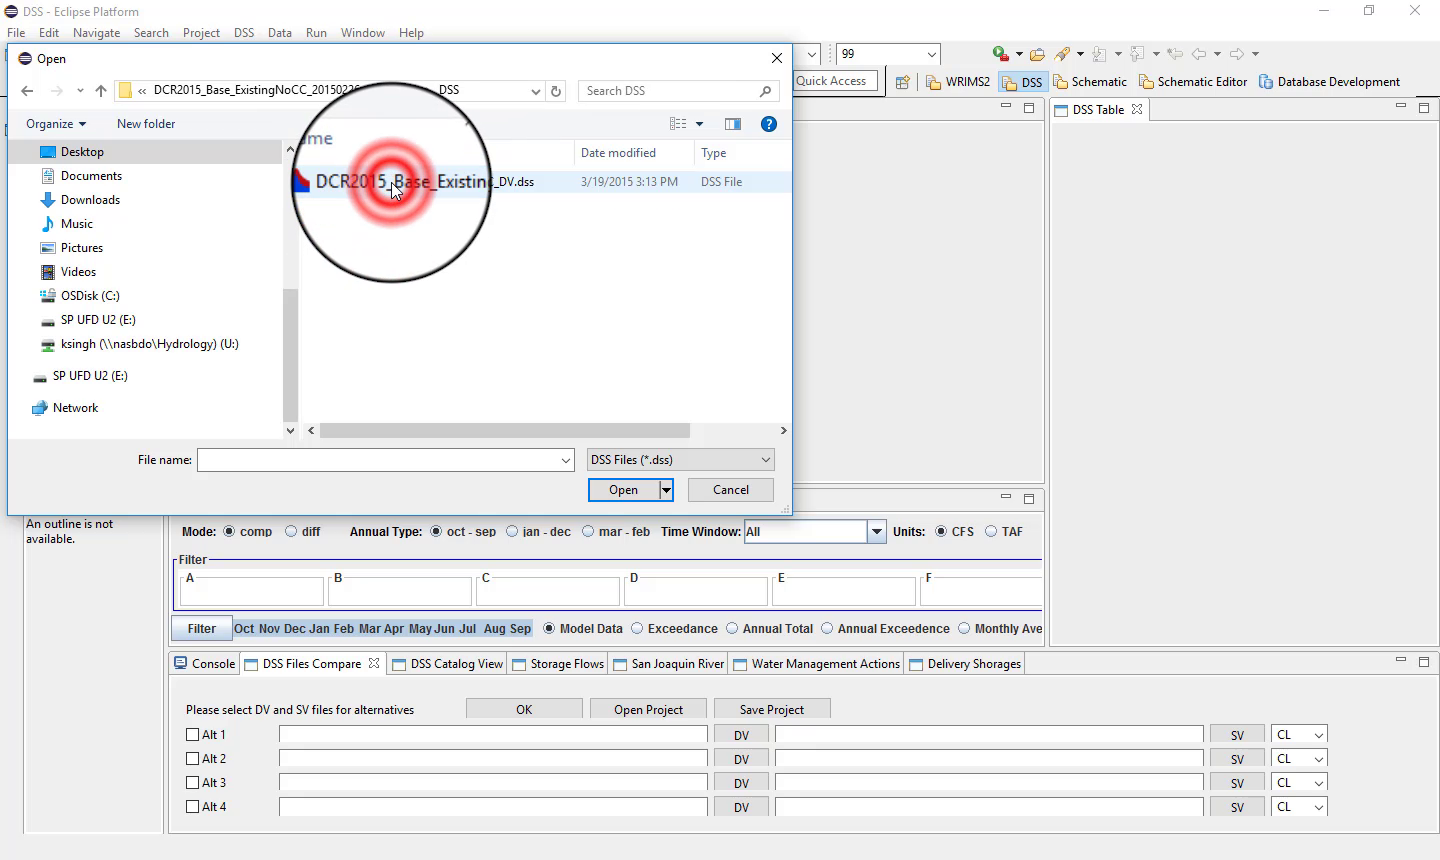
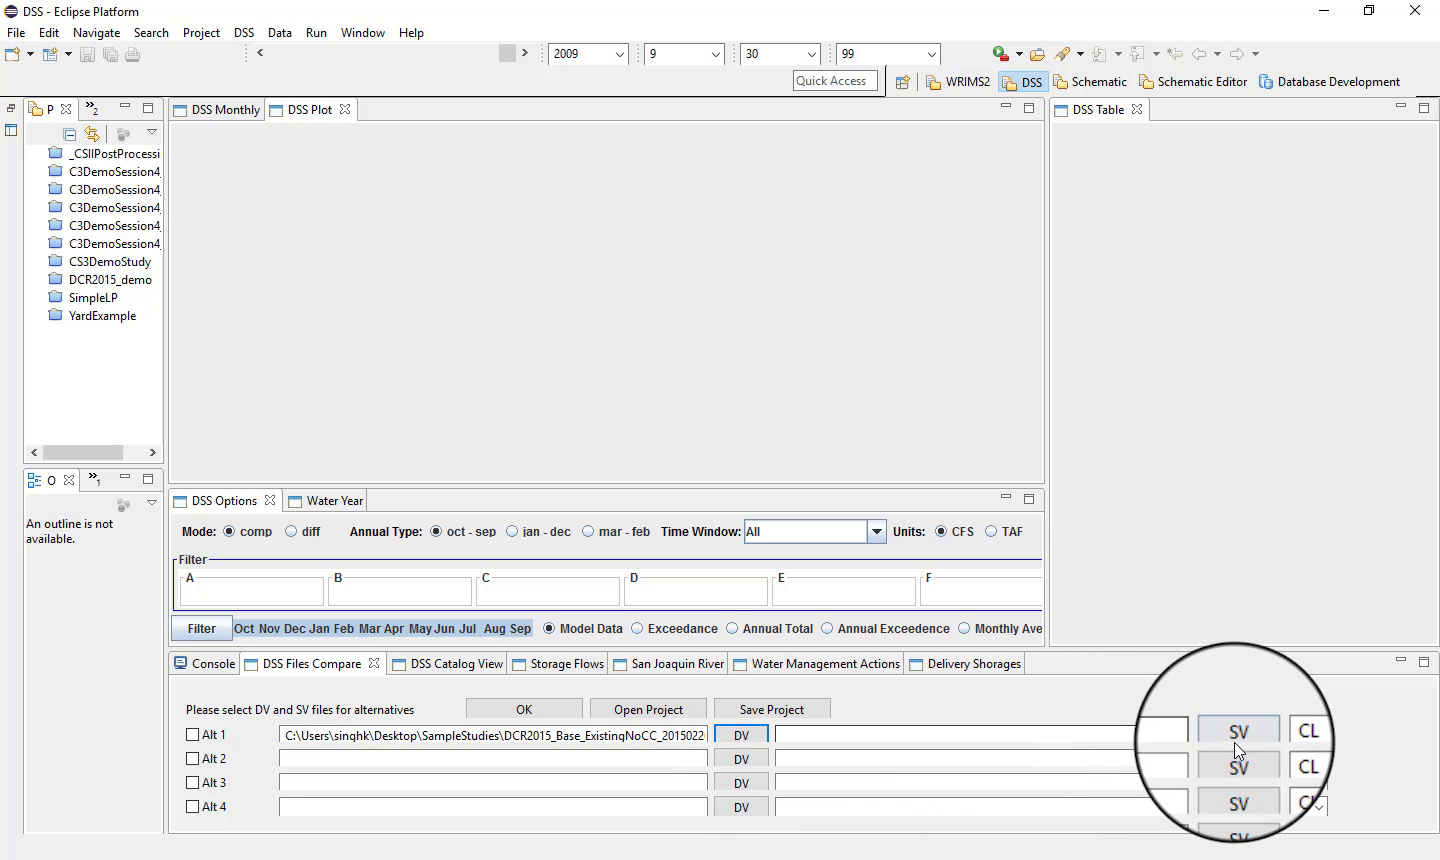
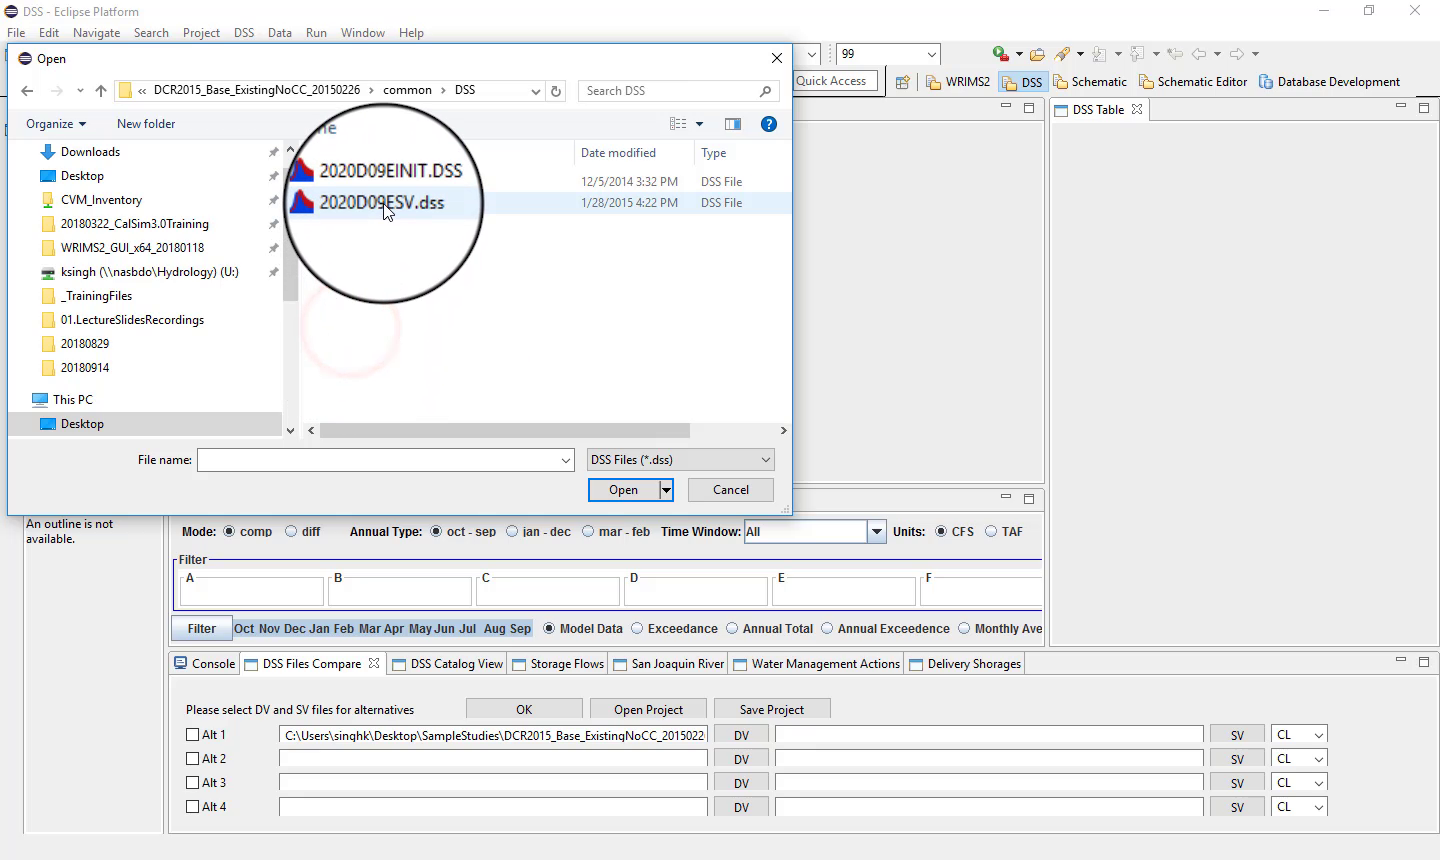
Load DSS files
Load the relevant DSS files for the two studies being compared.
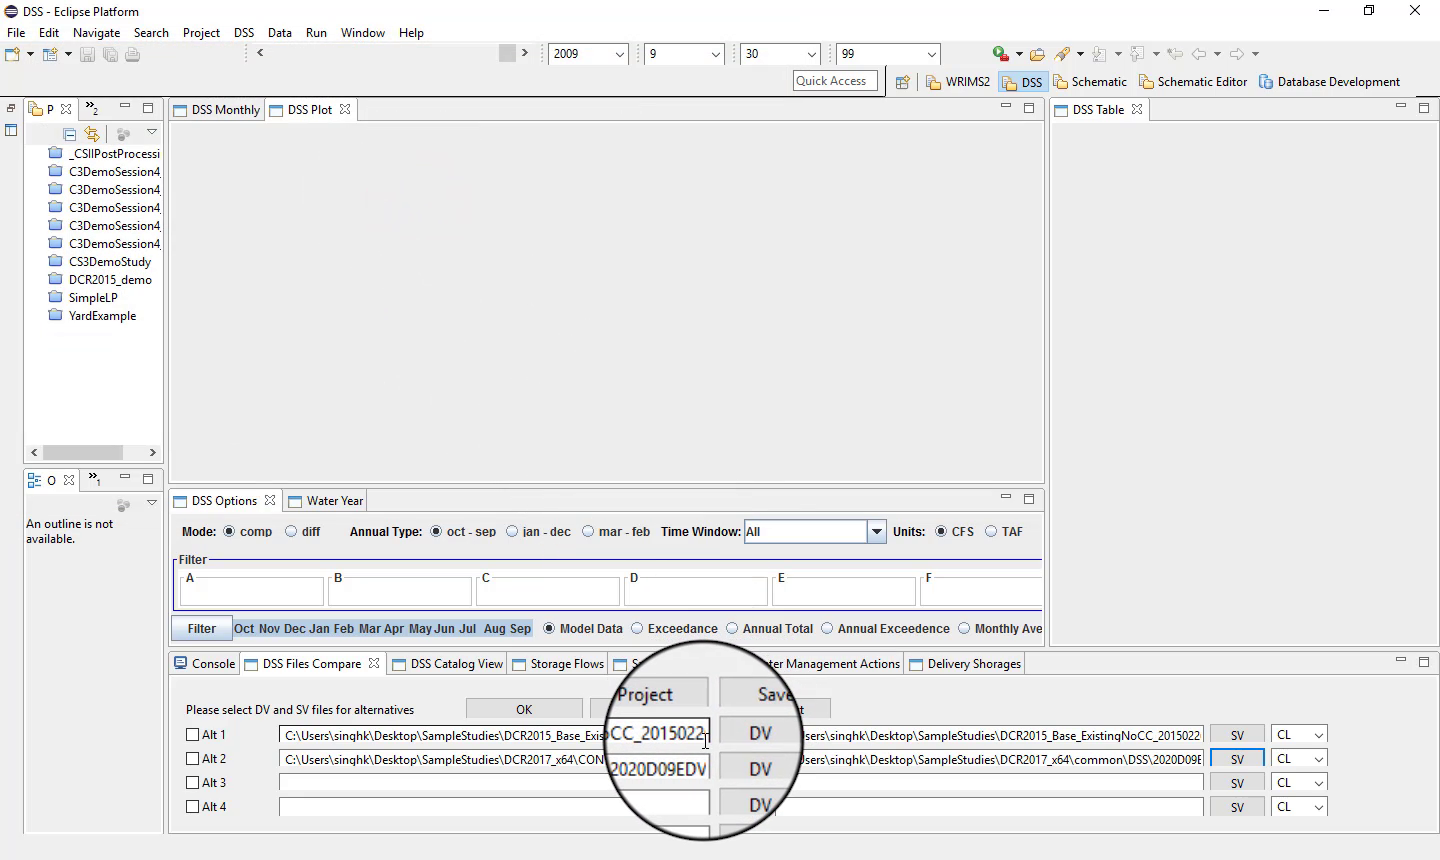
If multiple studies are loaded, select the two studies you want to compare and click OK.
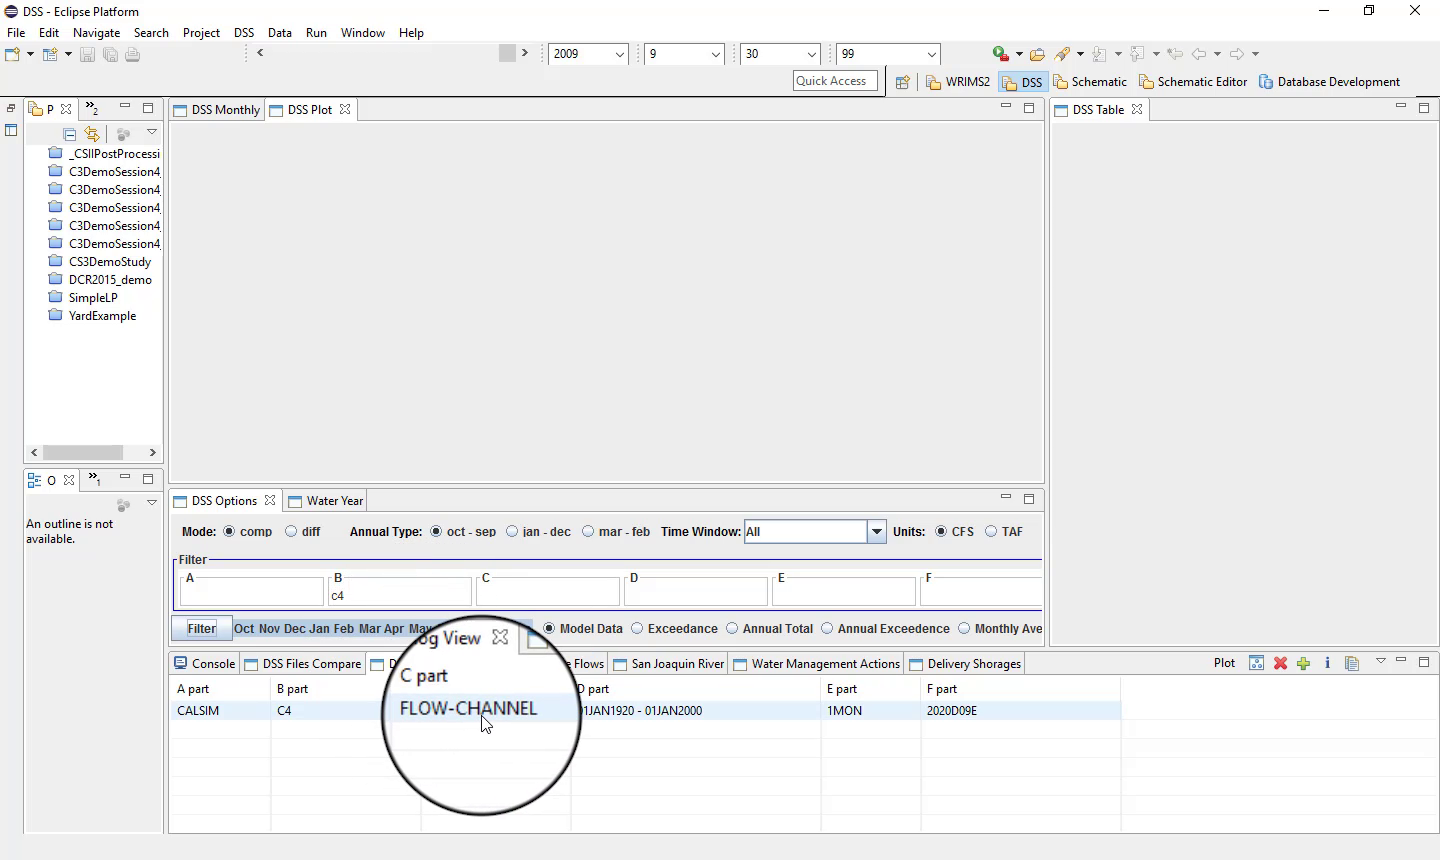
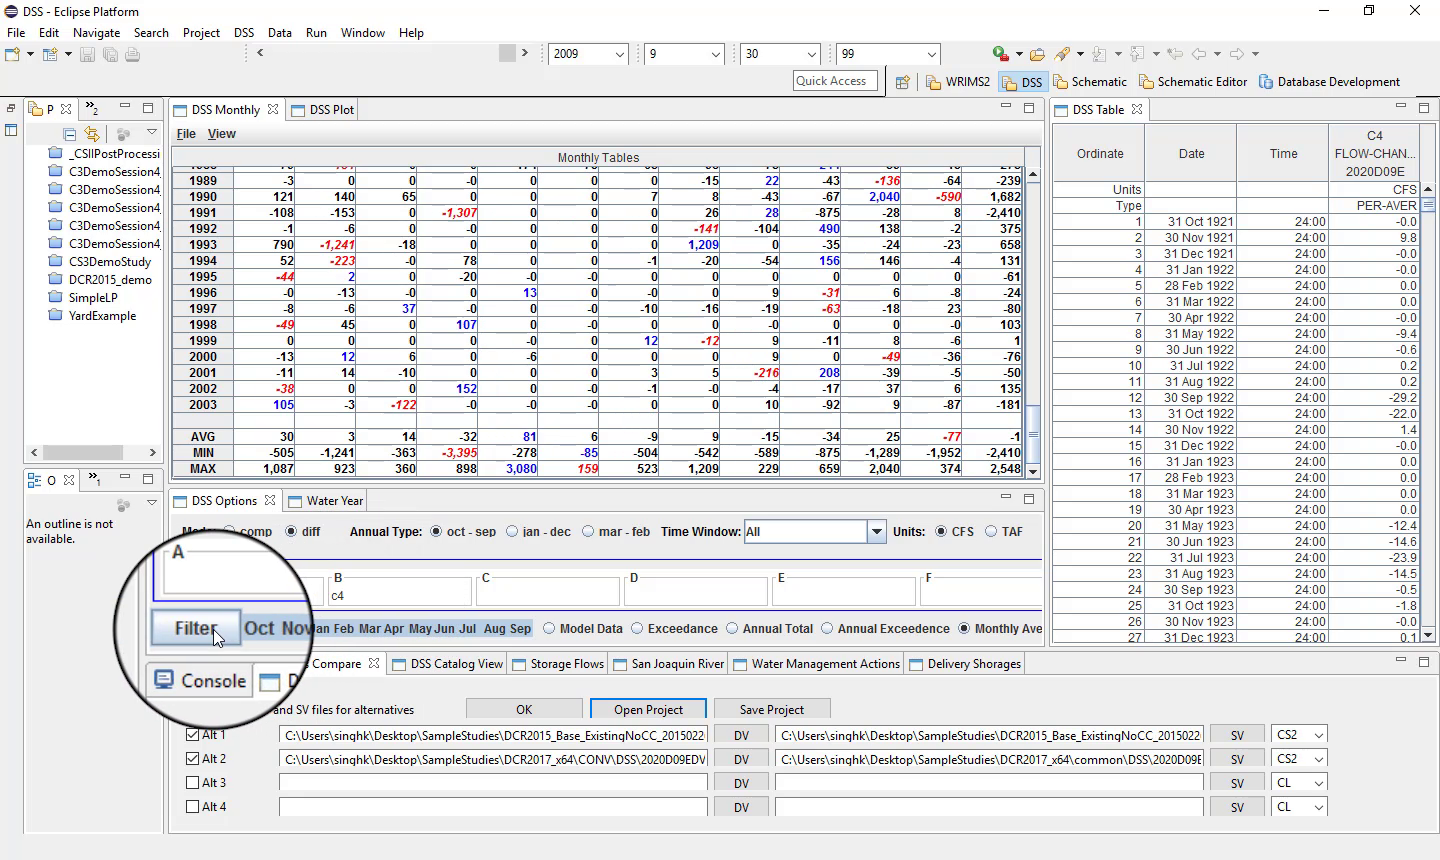
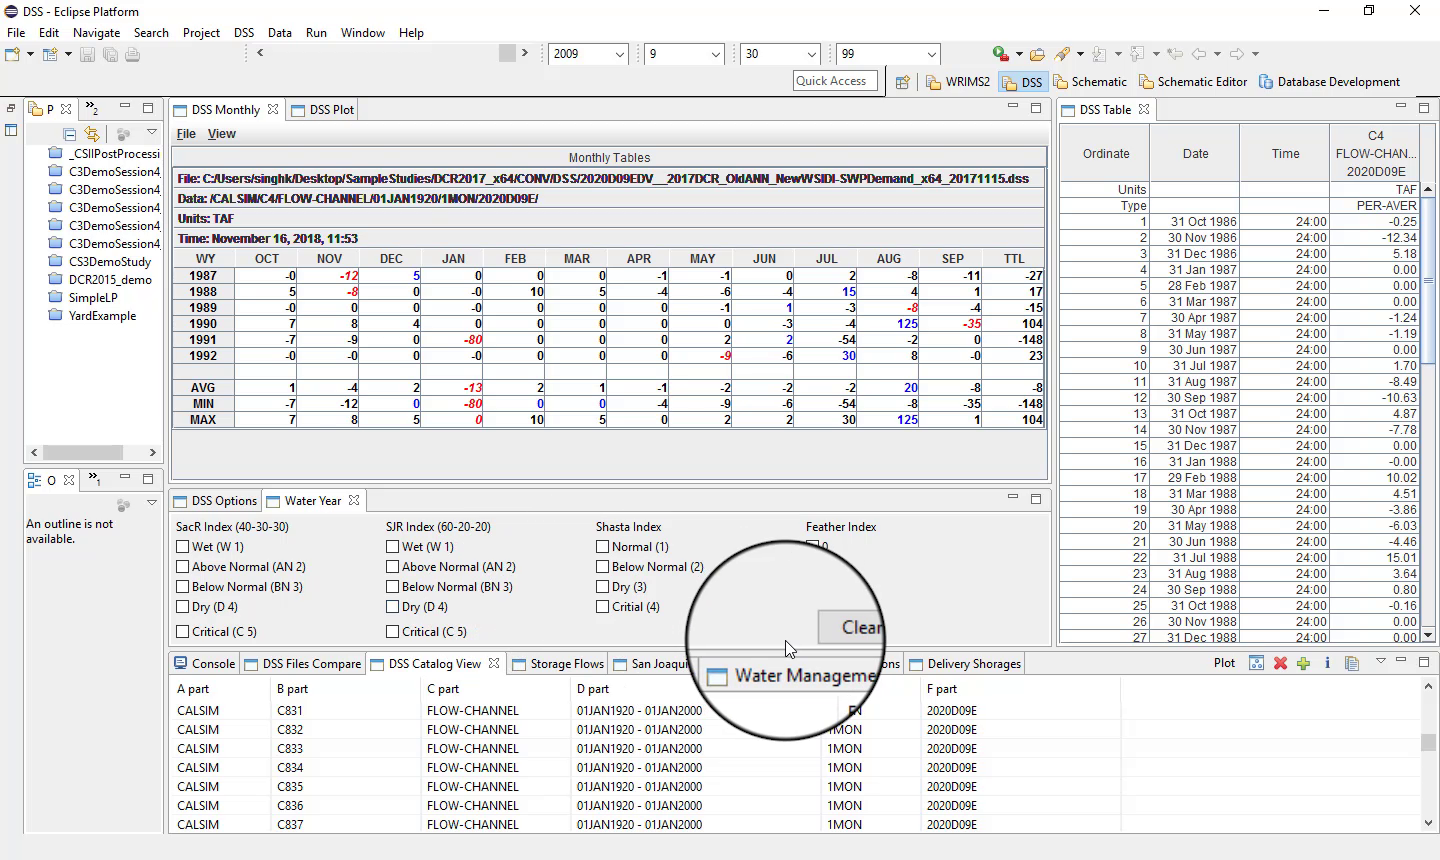
Filter records
Once the files are loaded, use the catalog view to filter DSS records by path parts, especially:
B part
C part
Entering a B part, for example, filters the record list to matching variables.
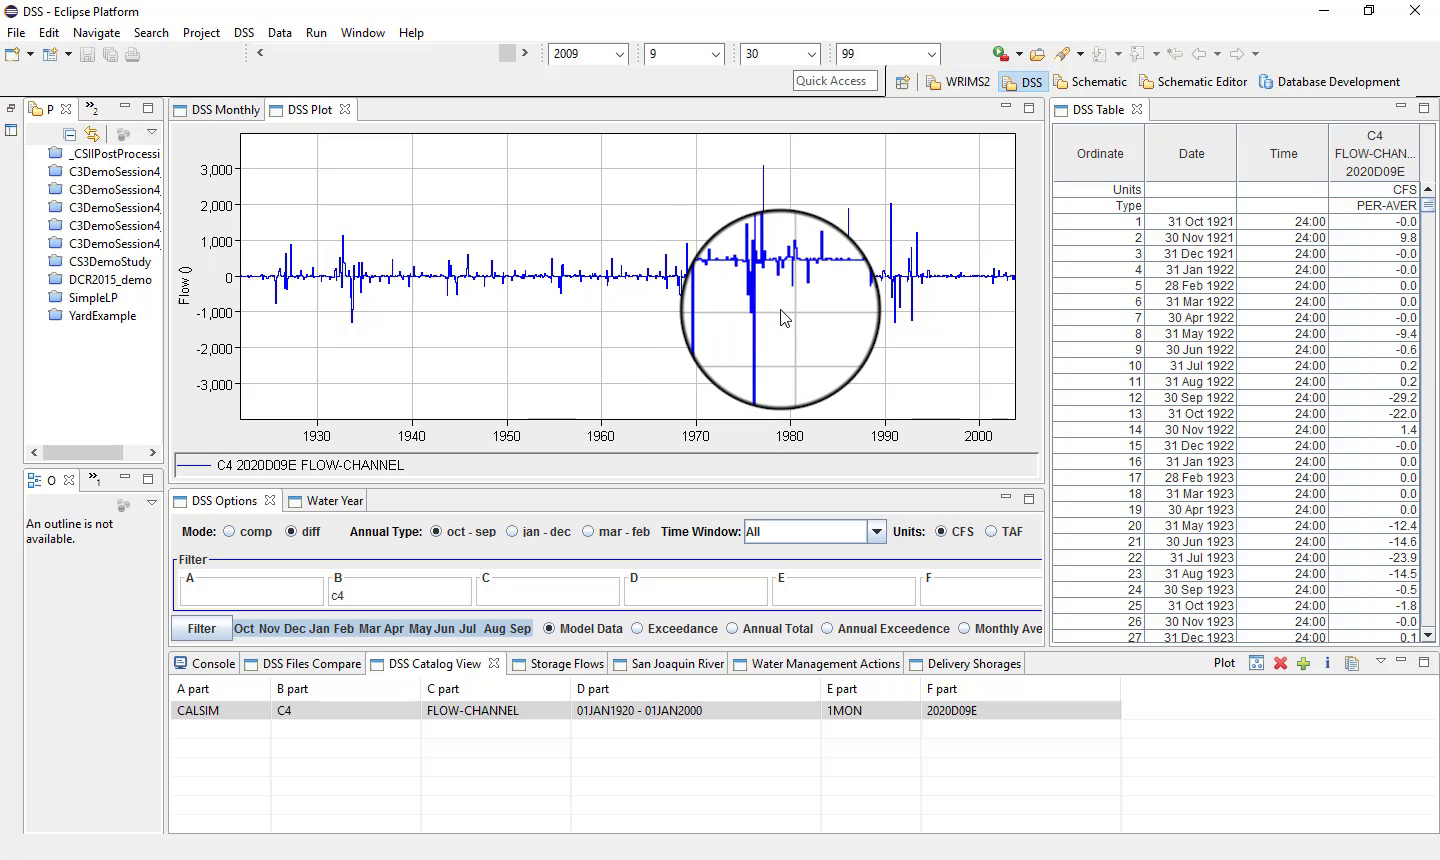
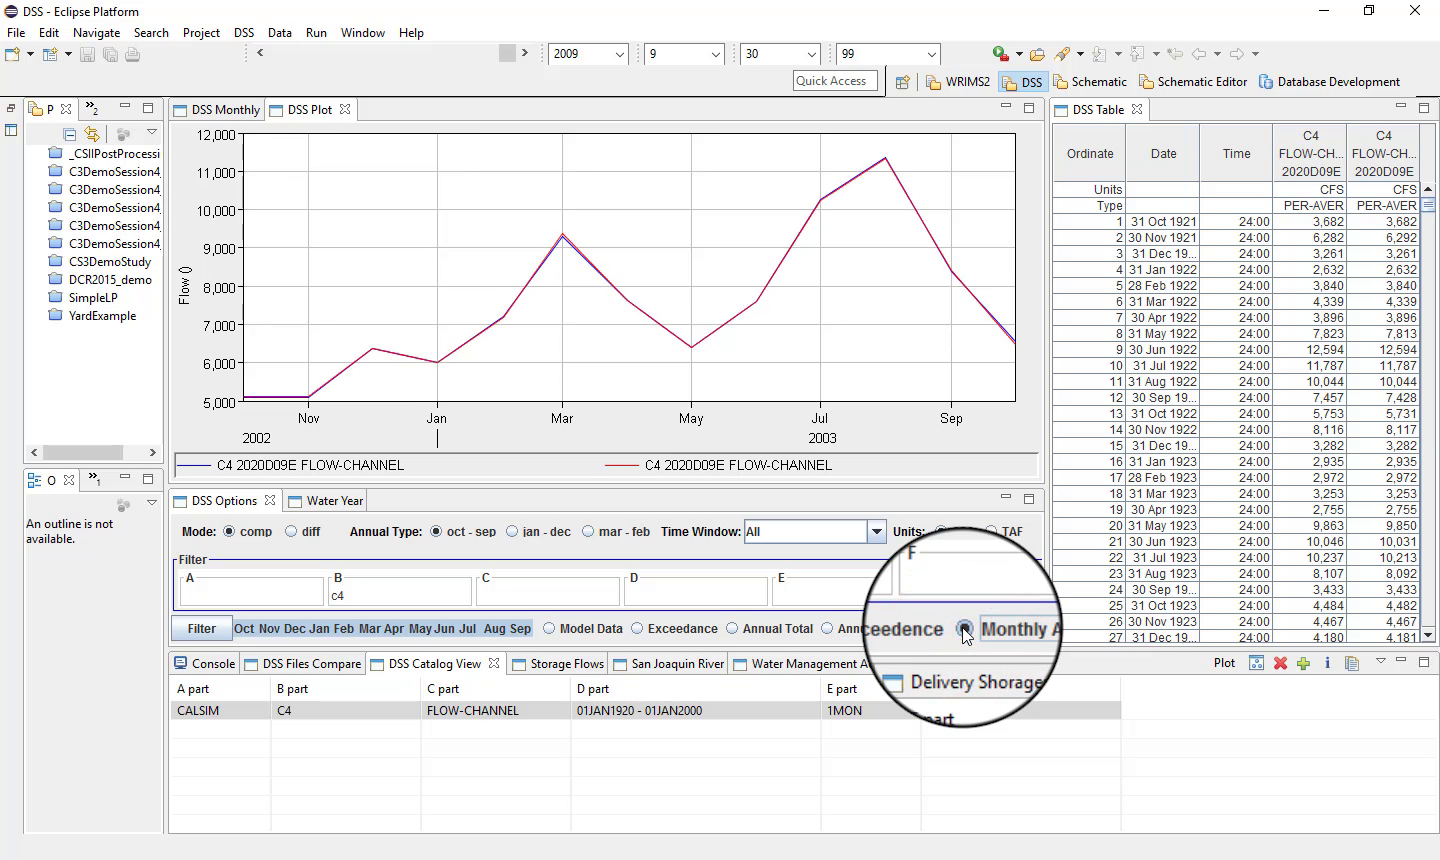
View plots and tables
After selecting a variable, WRIMS 3 GUI can display:
a plot;
a time-series table;
side-by-side comparison tables.
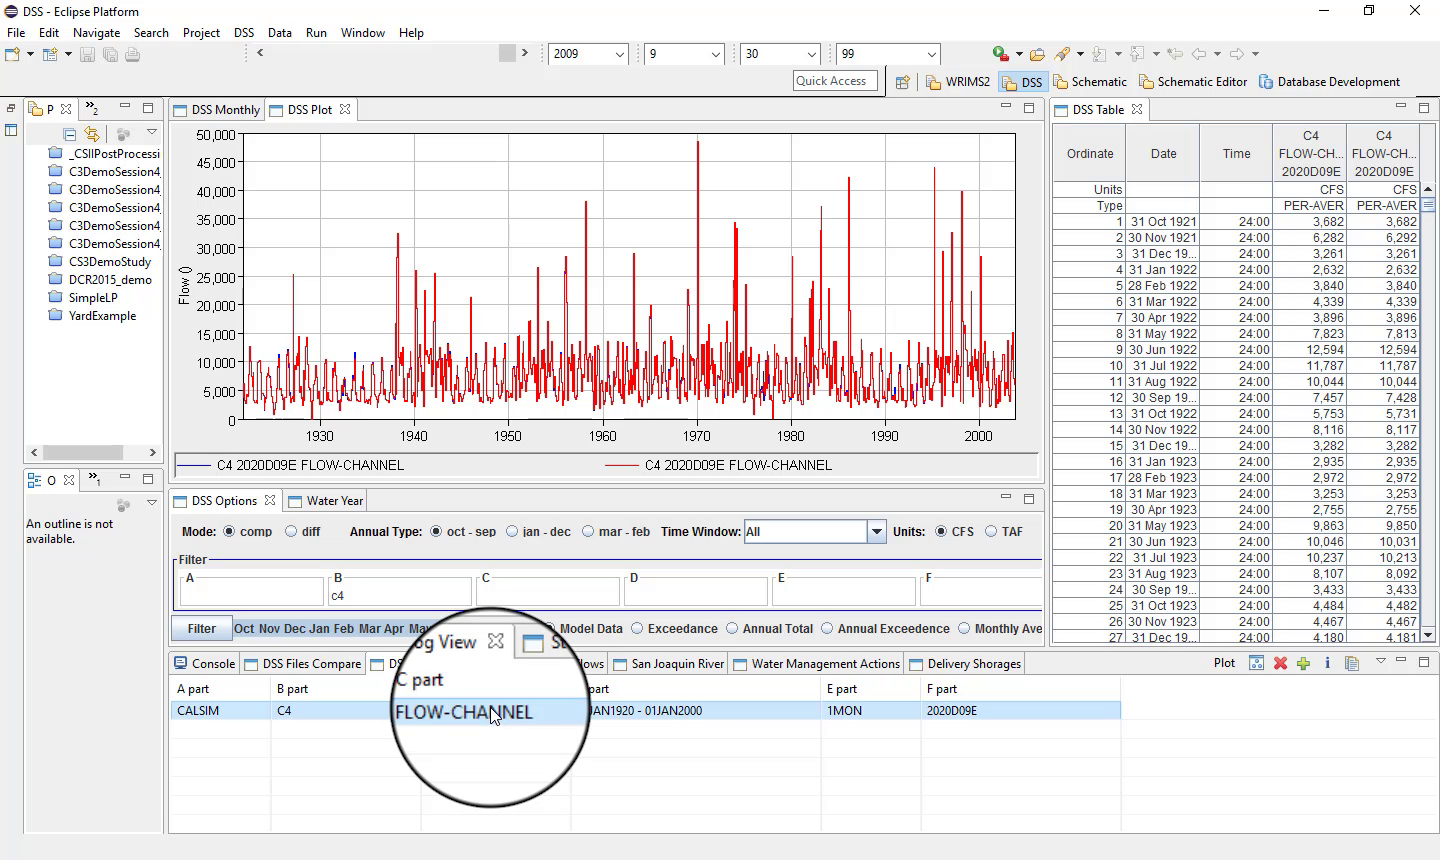
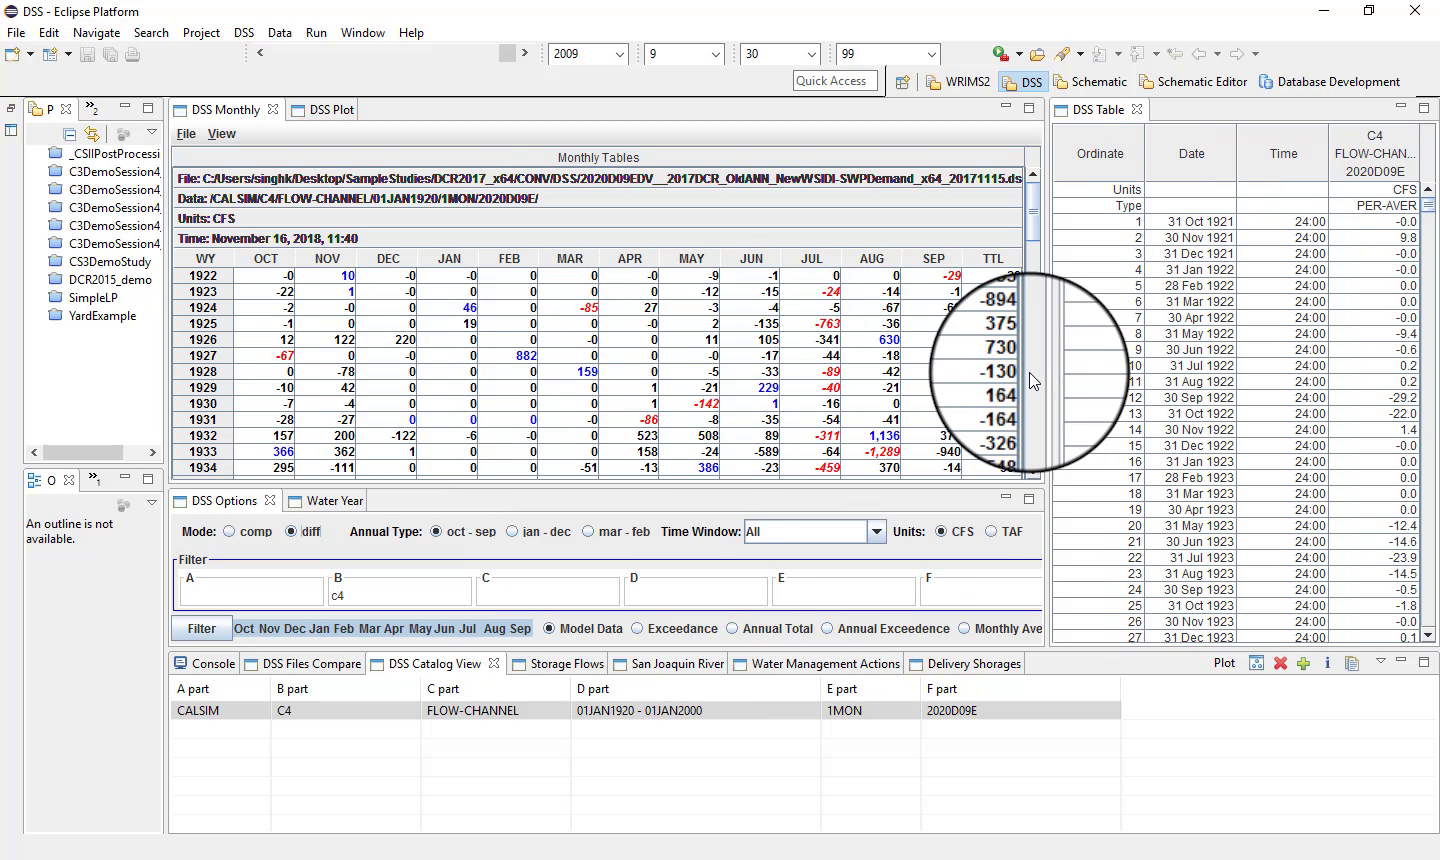
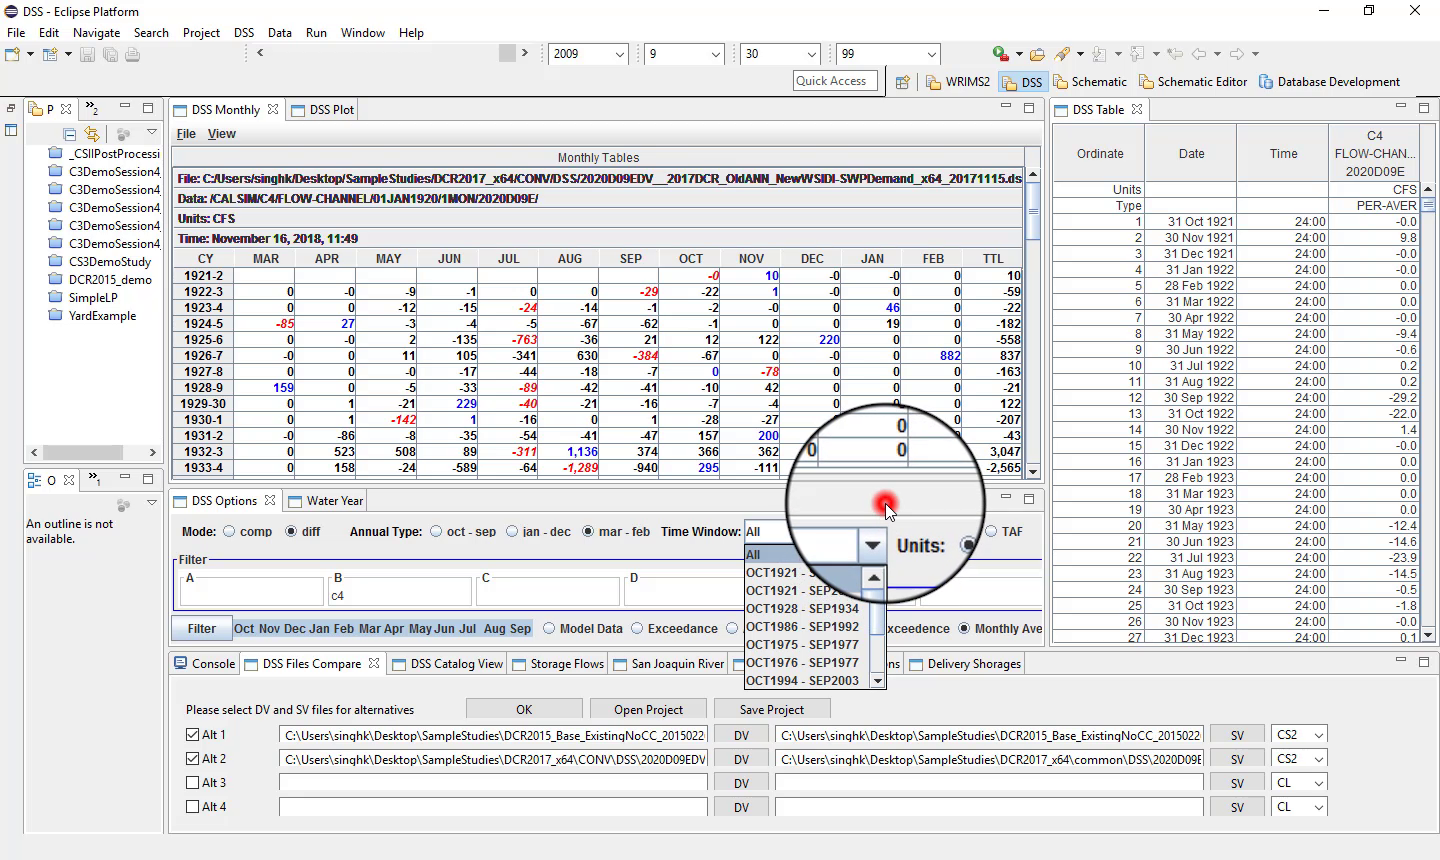
The example shown here covers the full model period from October 1921 through September 2003.
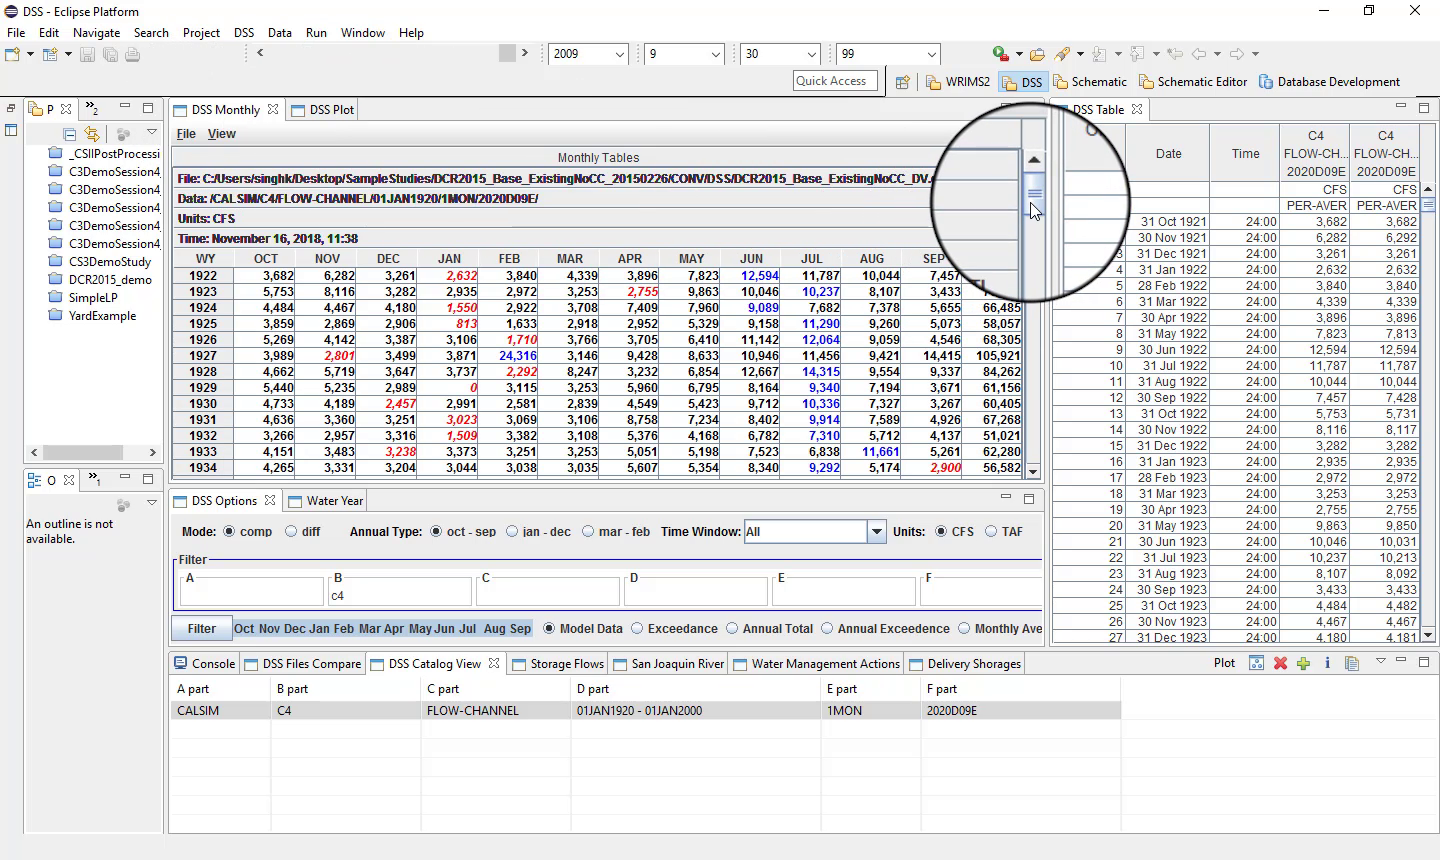
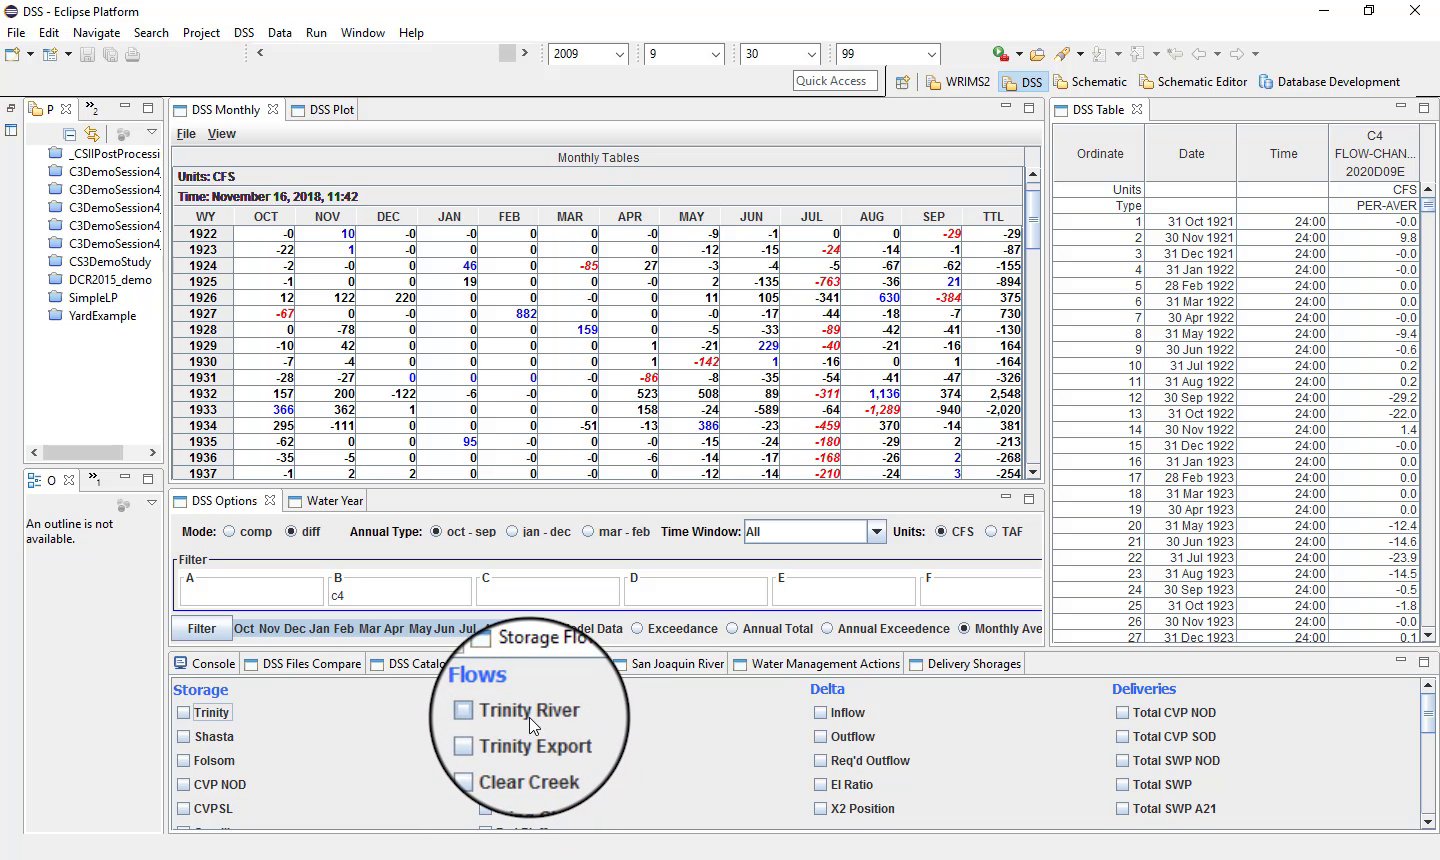
Difference view
Difference view can display:
monthly differences;
annual statistics;
average annual value;
minimum values;
maximum values;
average monthly values.
Color coding is also used:
blue may indicate maximum values;
red may indicate minimum values.
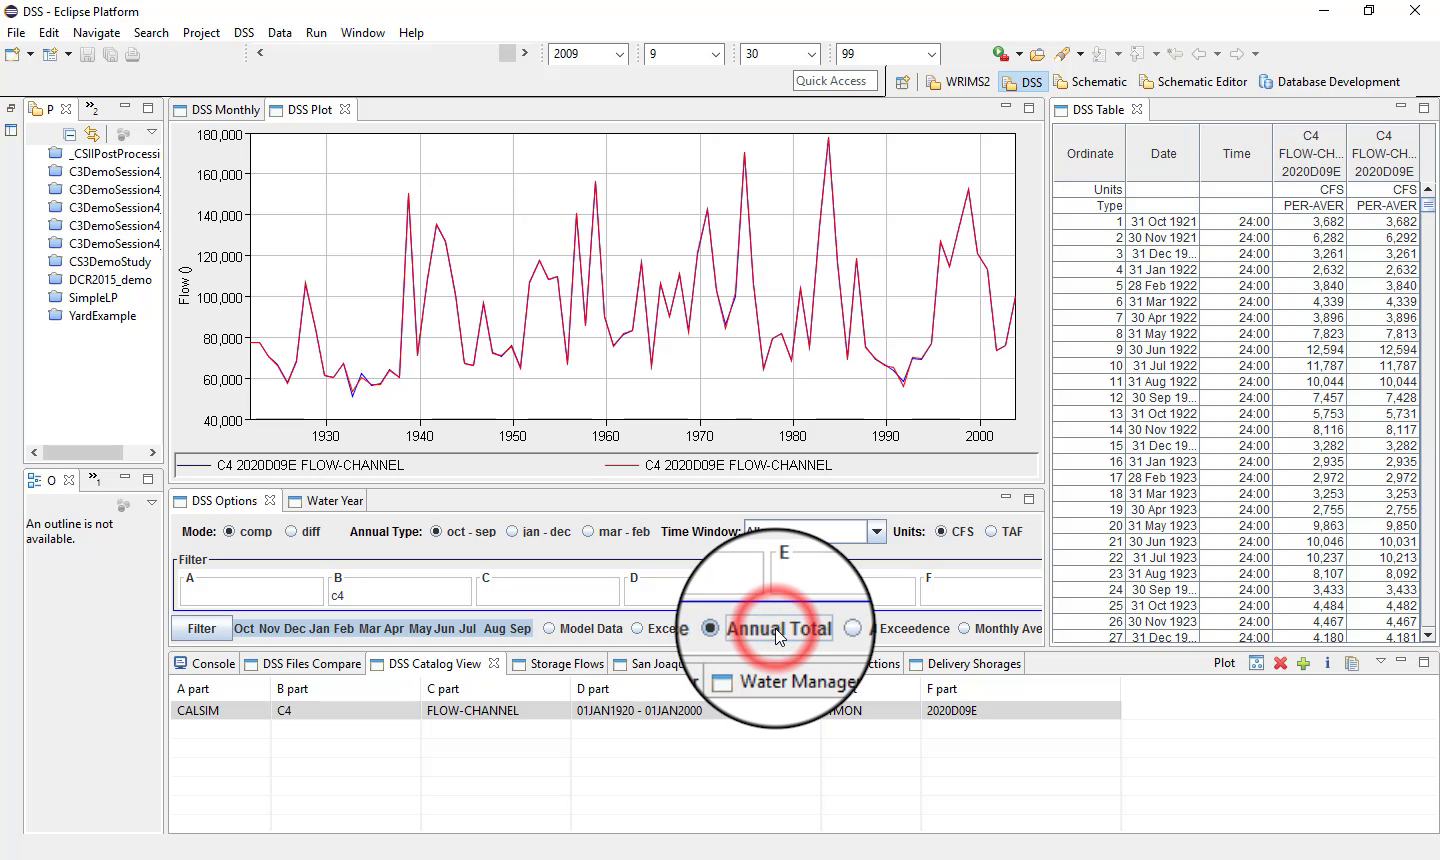
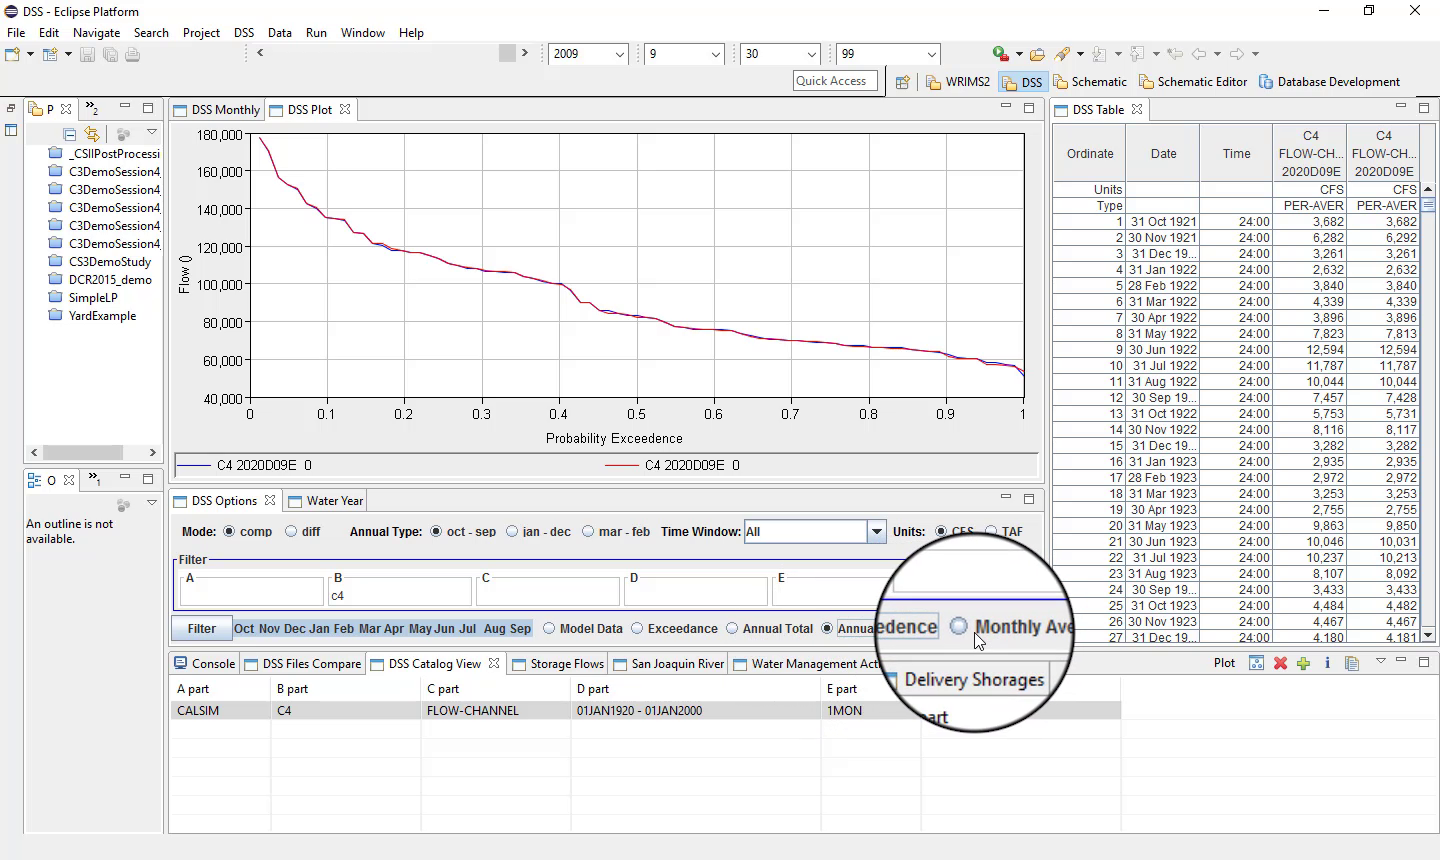
Different chart types
The DSS Perspective also supports:
plots;
annual totals;
exceedance views;
monthly averages.
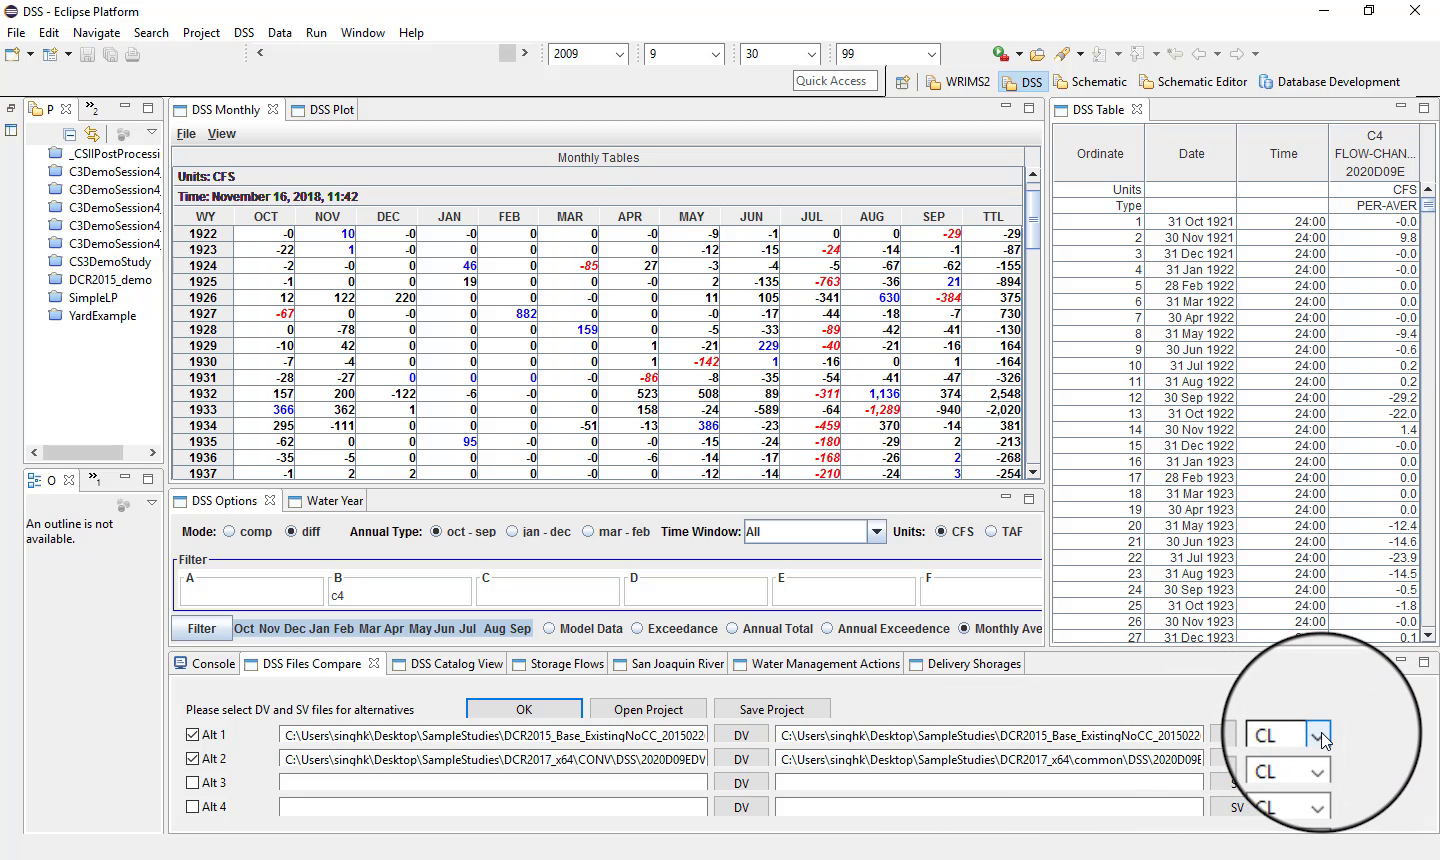
Shortcut buttons
Shortcut buttons can be used to select outputs by system feature or location, but they depend on choosing the correct CalSim type first.
If both studies are CalSim 2, for example, select that model type first.
Shortcut buttons can then be used for:
facilities;
locations;
storages;
shortages;
selected system features.
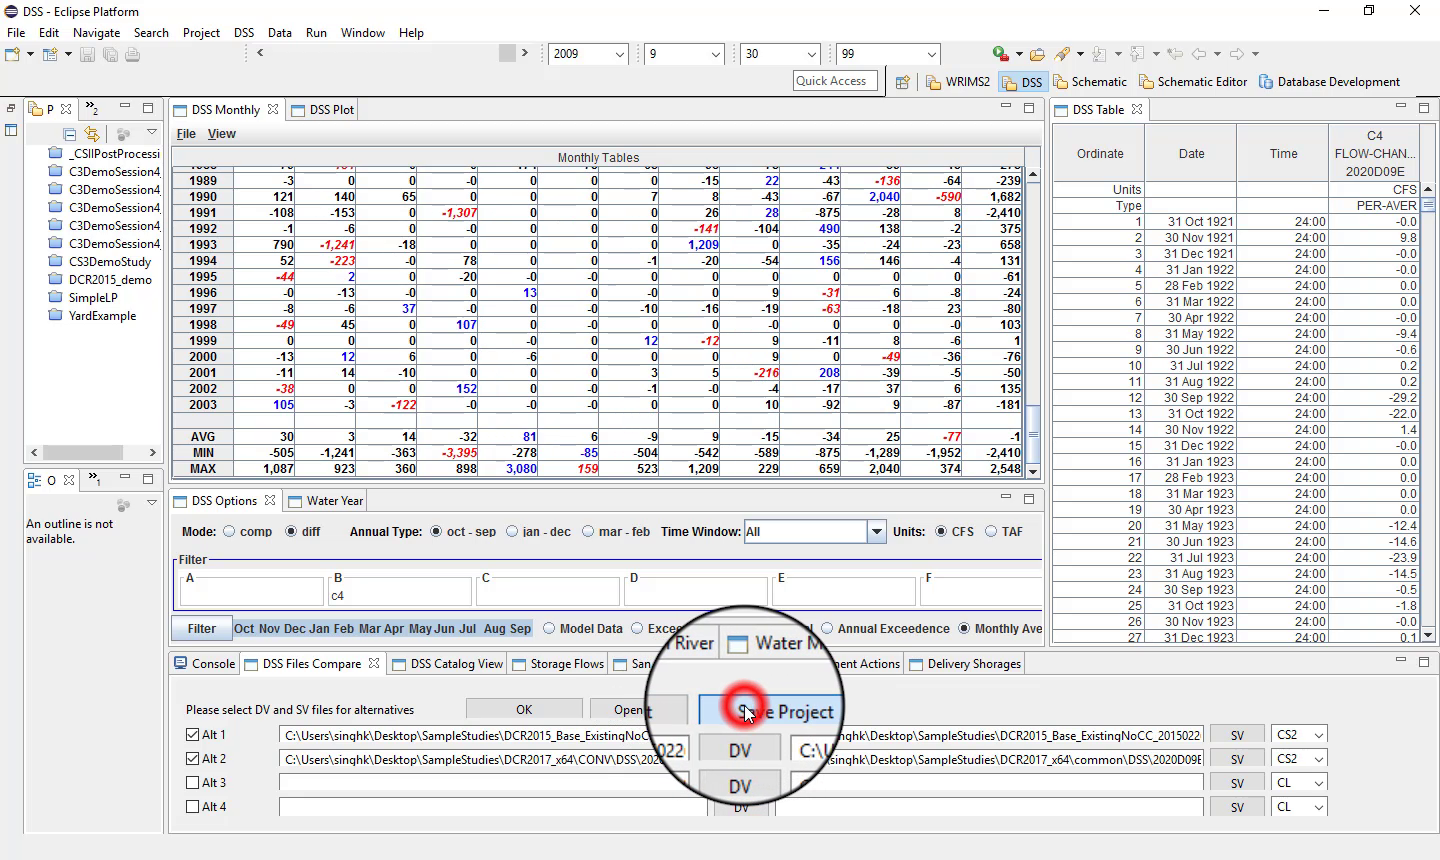
Save and reopen DSS compare projects
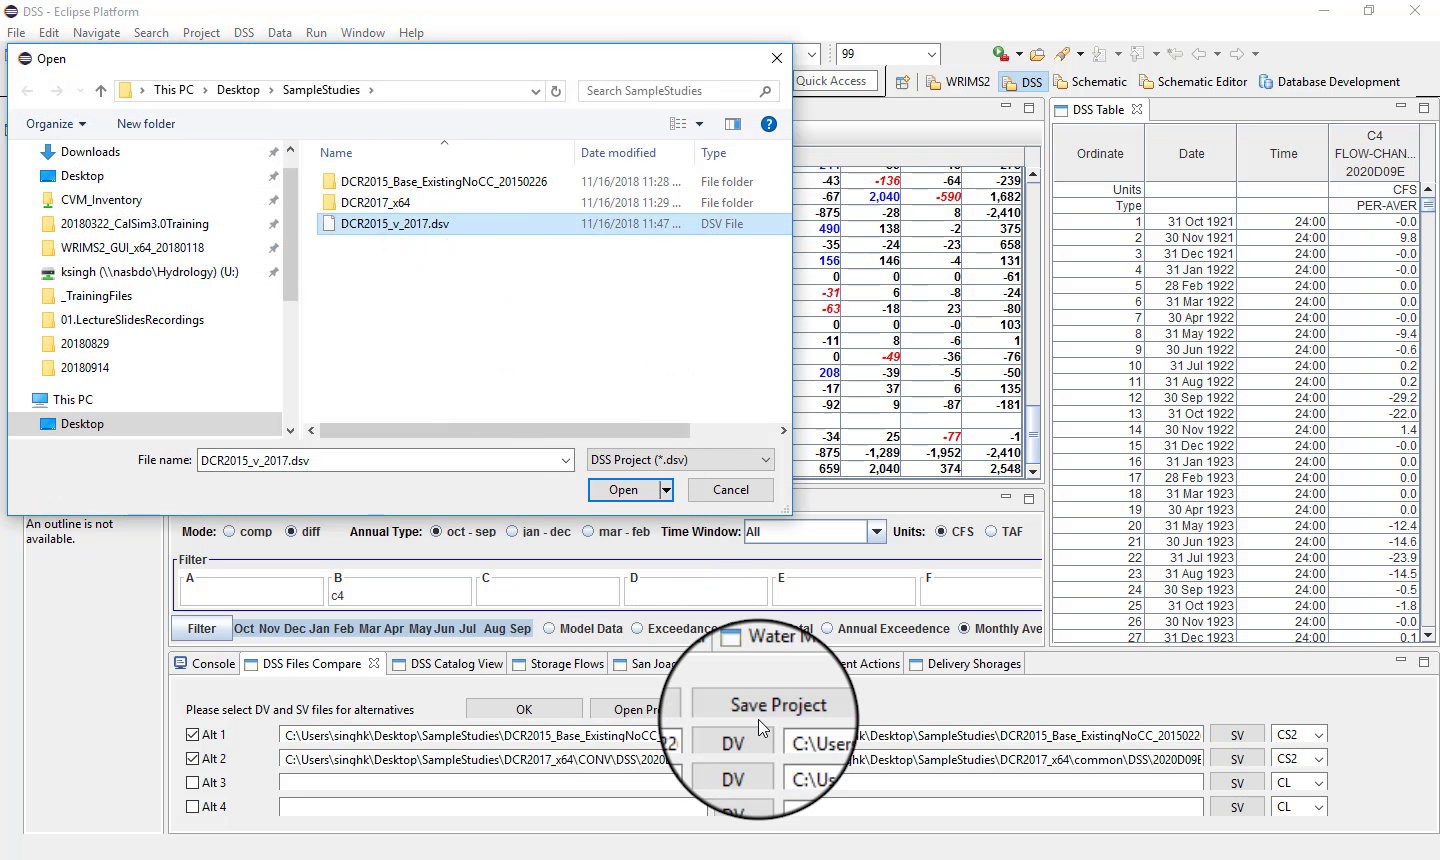
To avoid reloading the same DSS files repeatedly, save the DSS compare setup as a project file.
To save:
Click Save.
Choose a location.
Enter a file name.
Save the project.
To reopen it later:
Click Open Project.
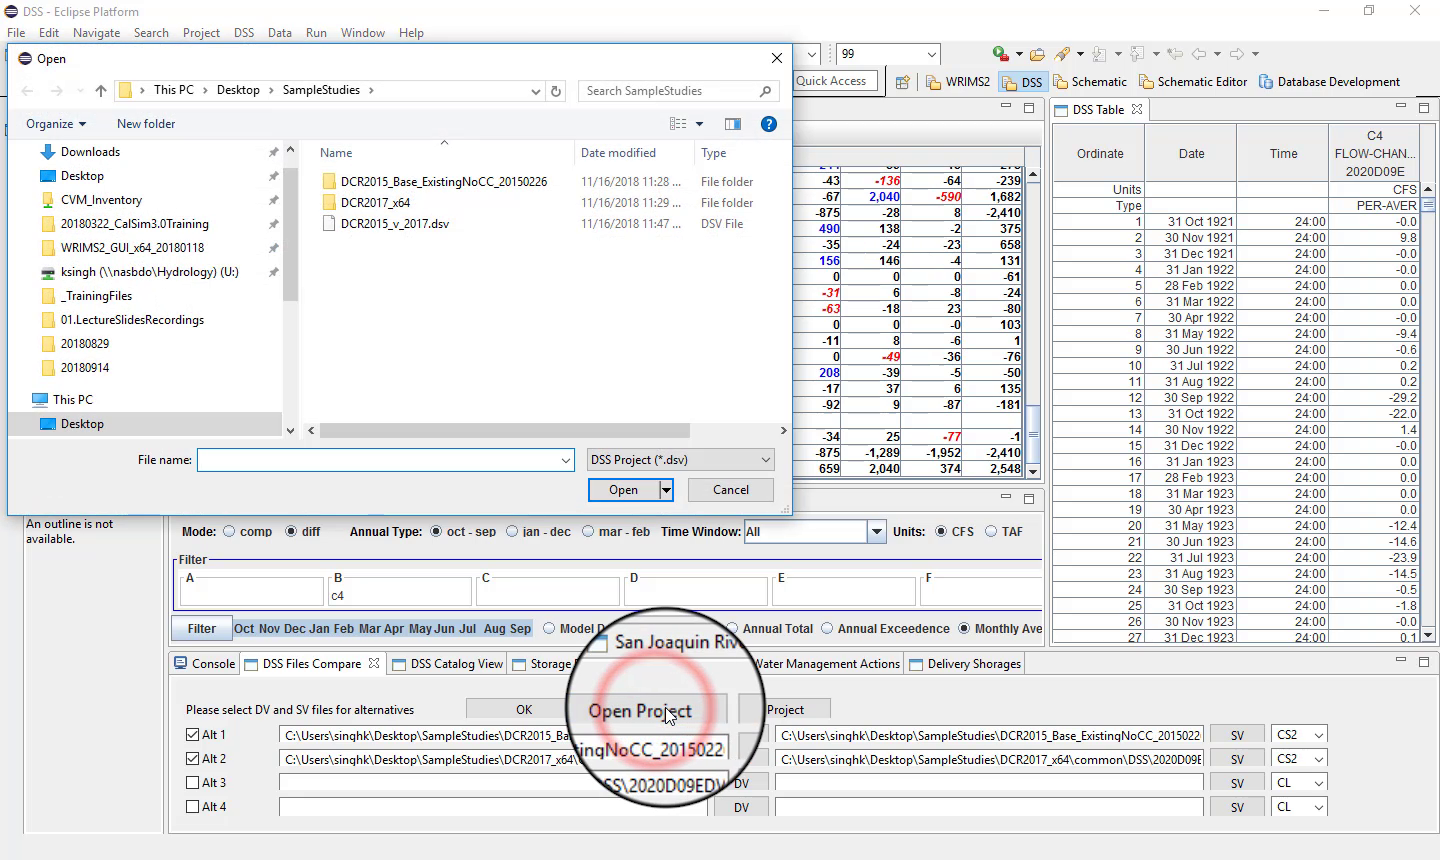
Select the saved project file.
Click Open.
Month filters
The DSS Perspective can also filter by month.
You can:
view all 12 months;
choose a single month;
choose multiple months by holding Shift.
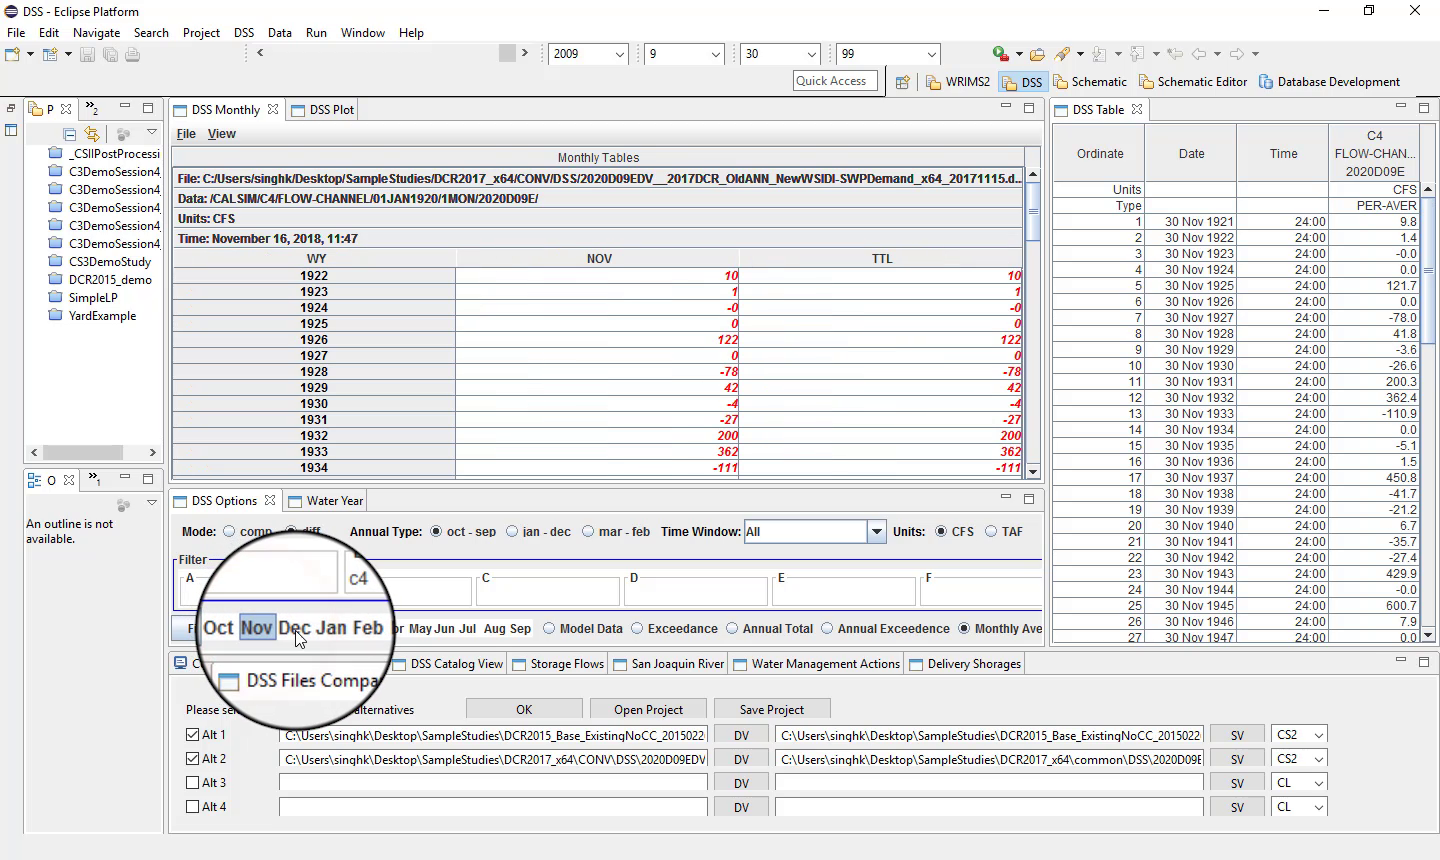
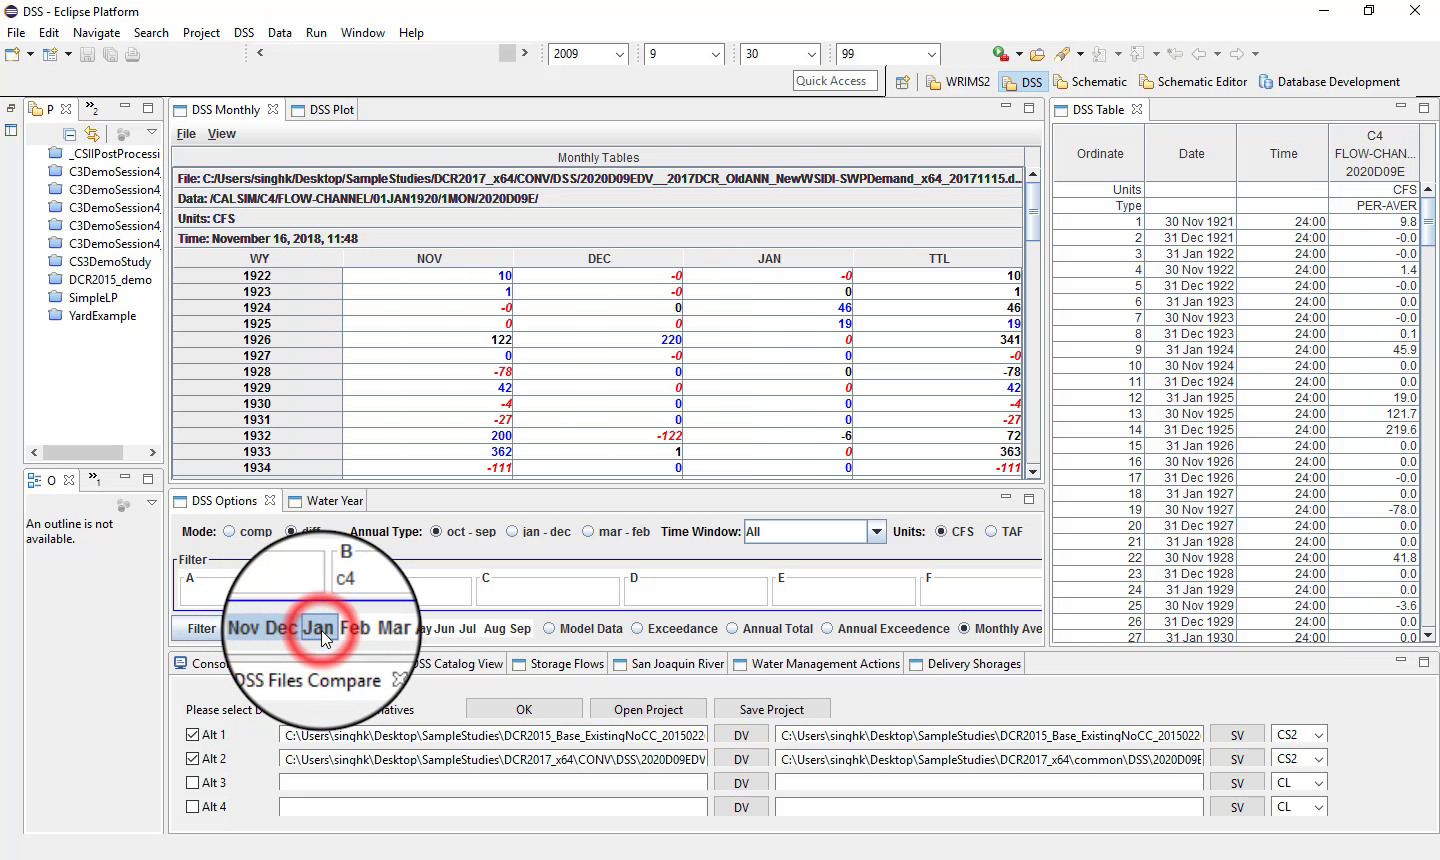
This is useful when focusing on specific seasons or operational periods.
Reporting year type
The DSS Perspective supports different year types:
Water year: October to September
Calendar year: January to December
CVP contract year: March to February
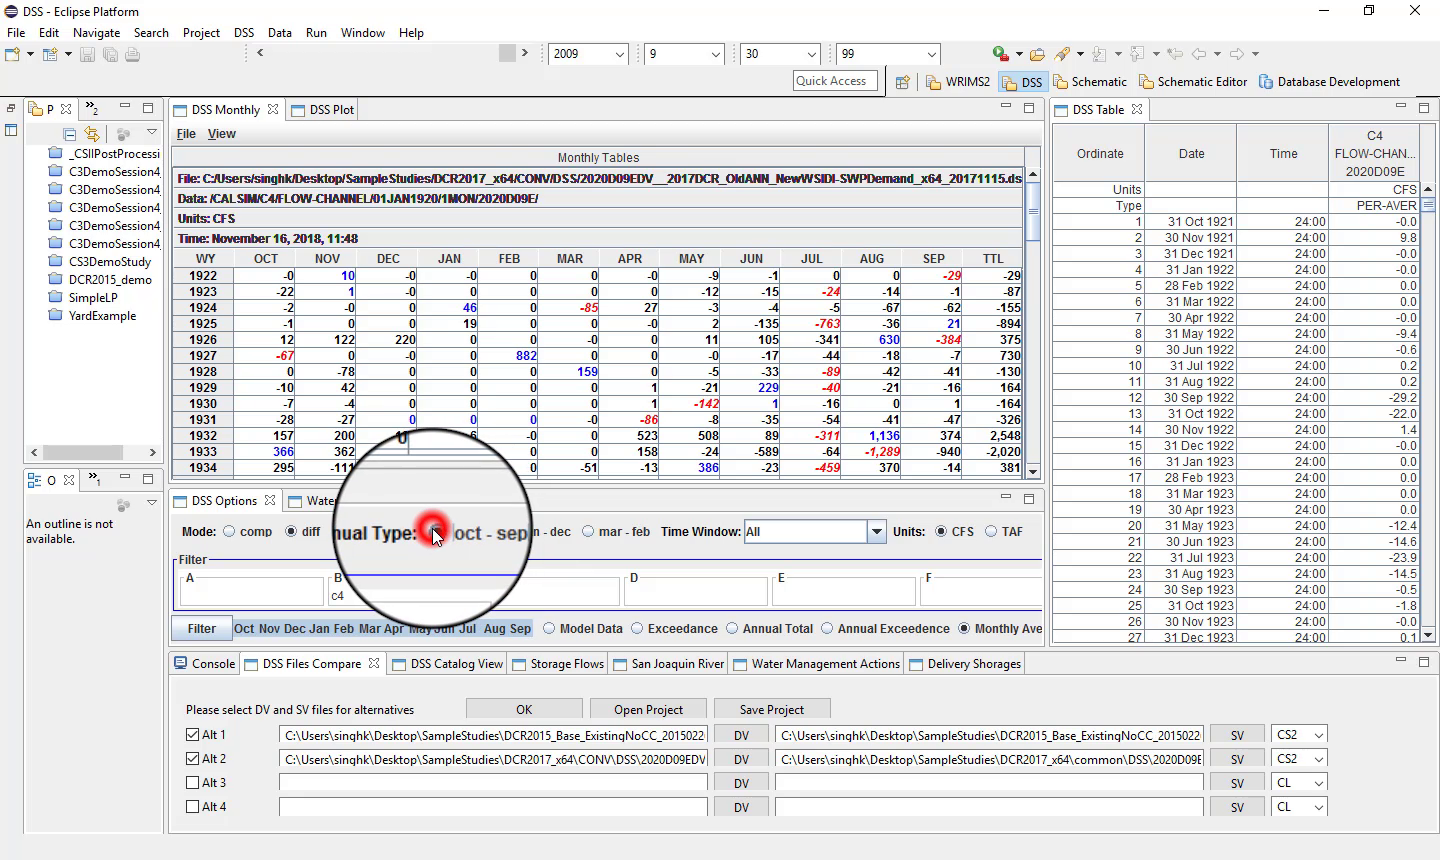
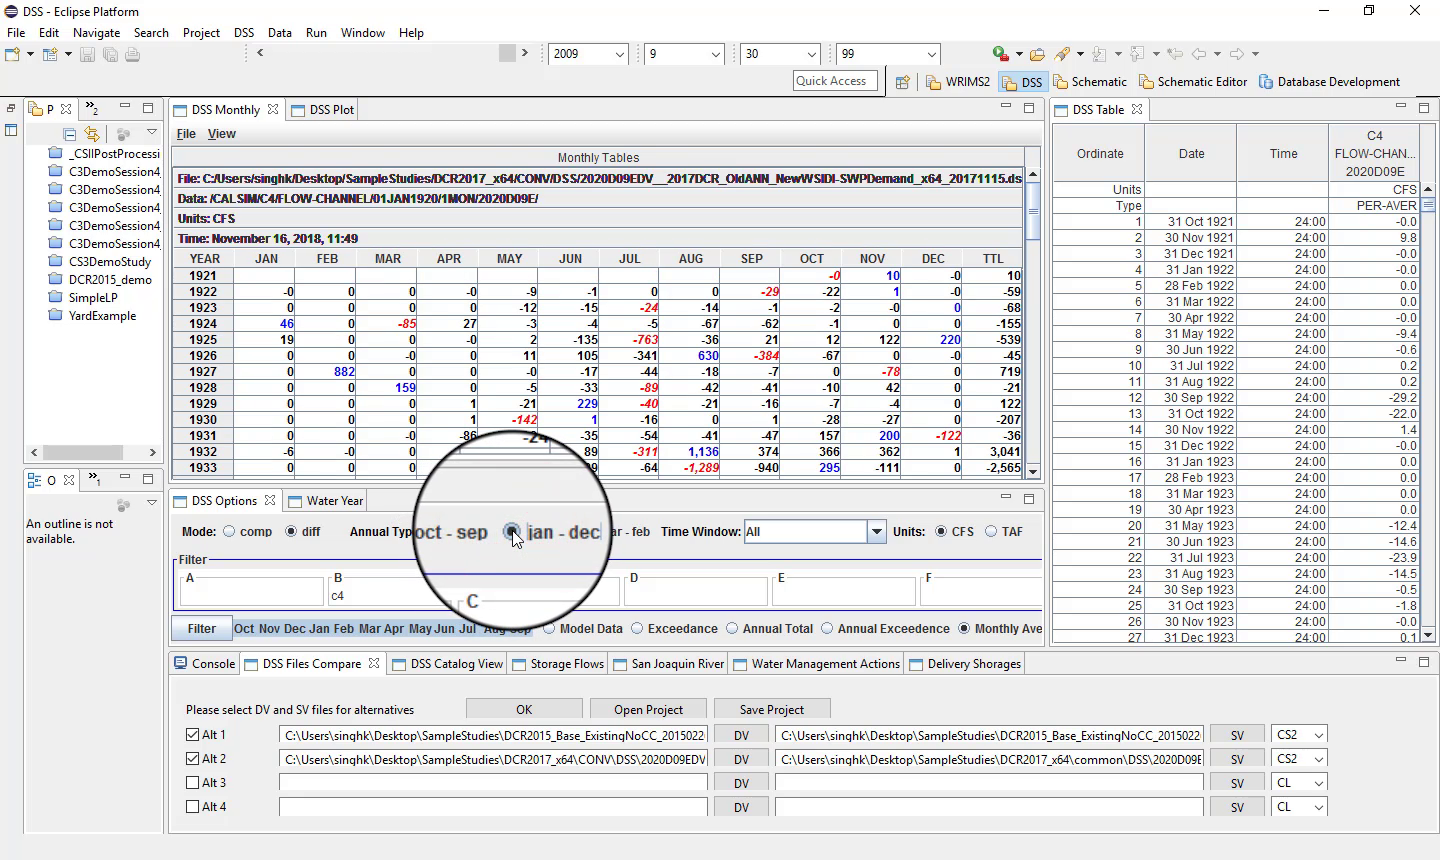
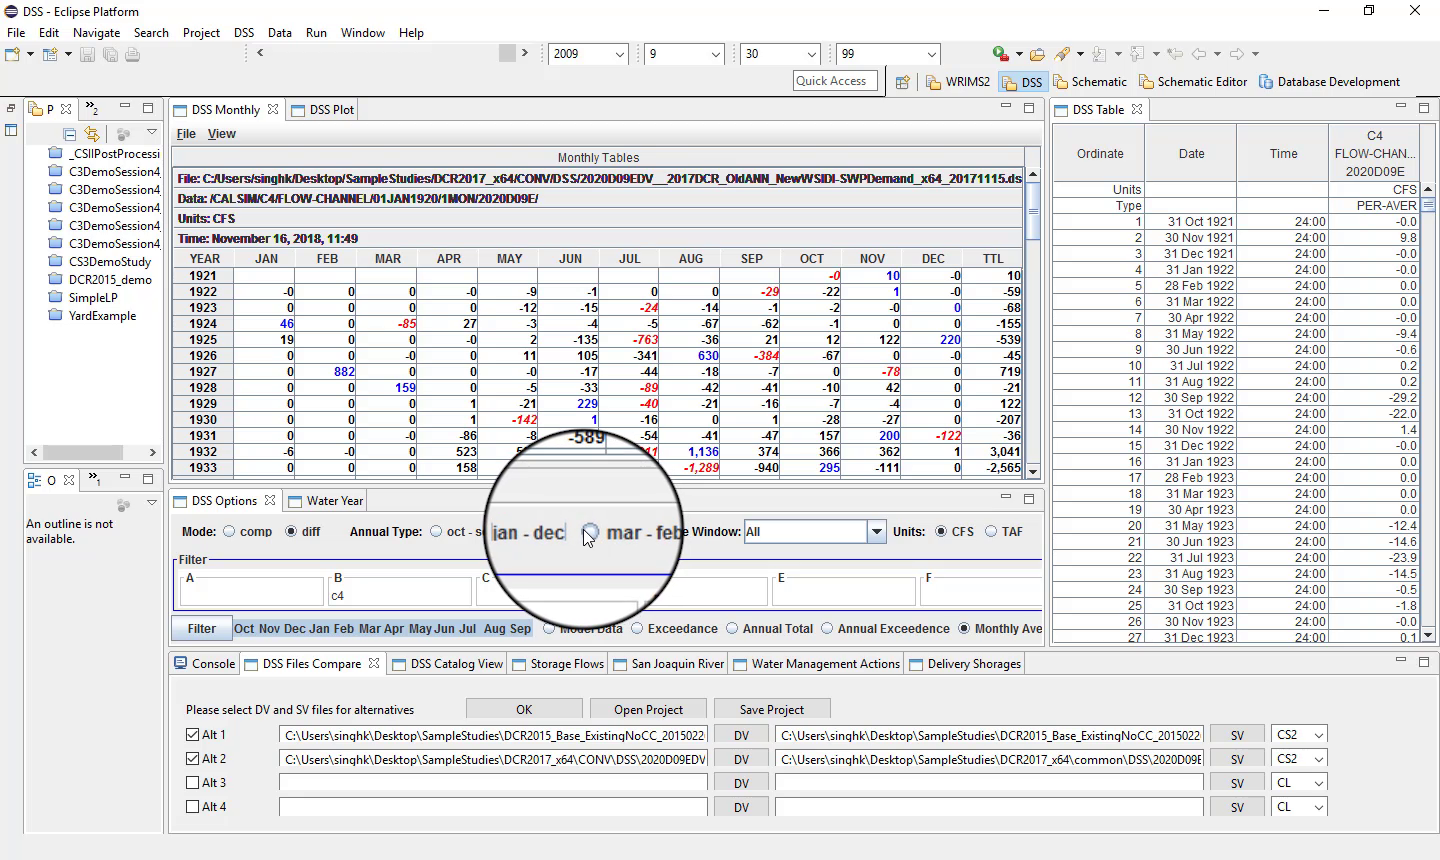
Typical uses include:
water year for most hydrologic analysis;
calendar year for SWP delivery or allocation analysis;
March to February for CVP deliveries and shortages.
Time window
The time window can also be changed.
Historical periods can be isolated, such as:
1928 to 1934;
1975 to 1977;
1987 to 1992.
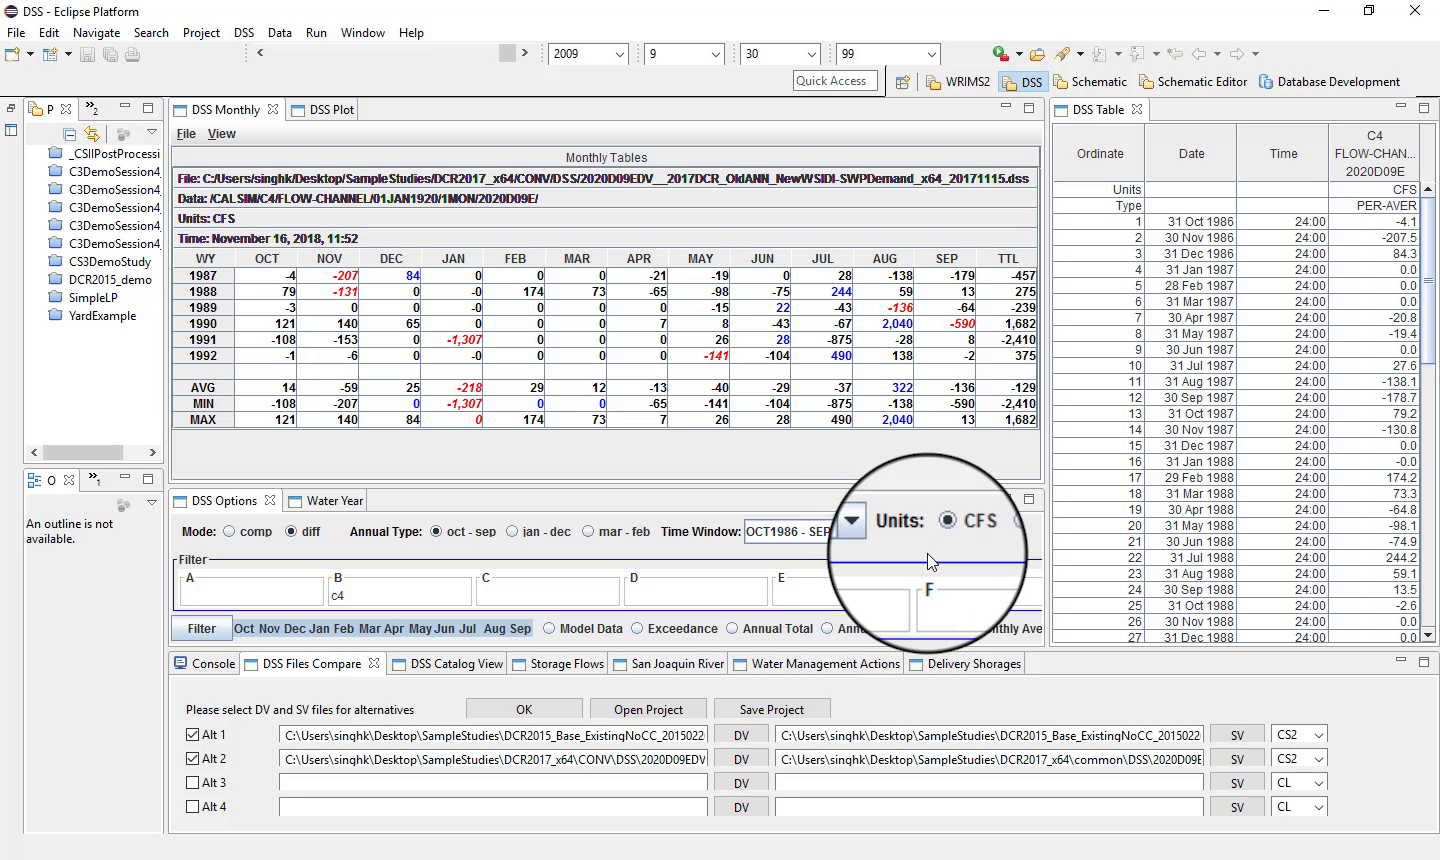
Units
Units can be changed, for example between:
TAF
CFS
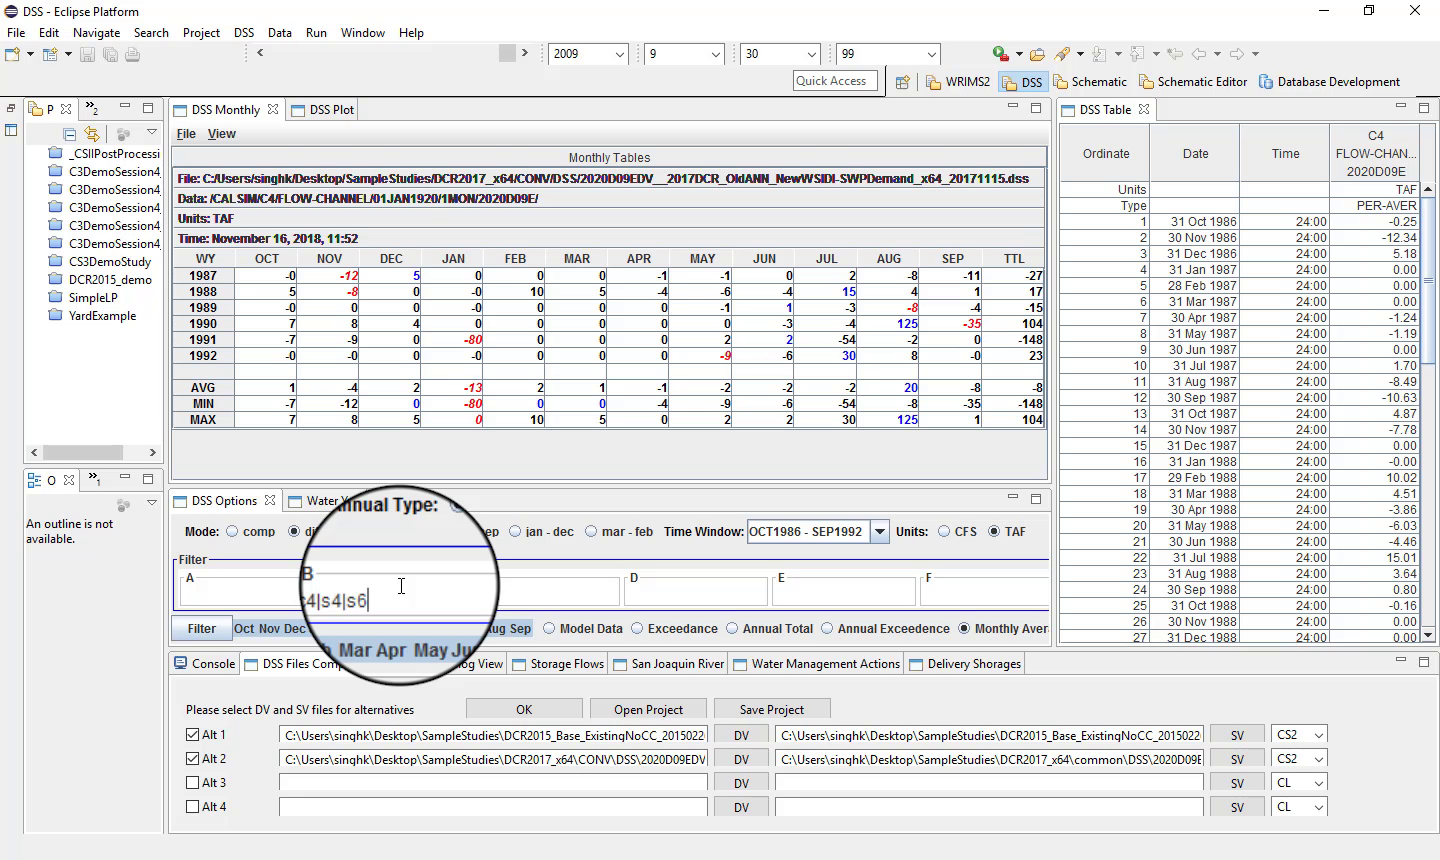
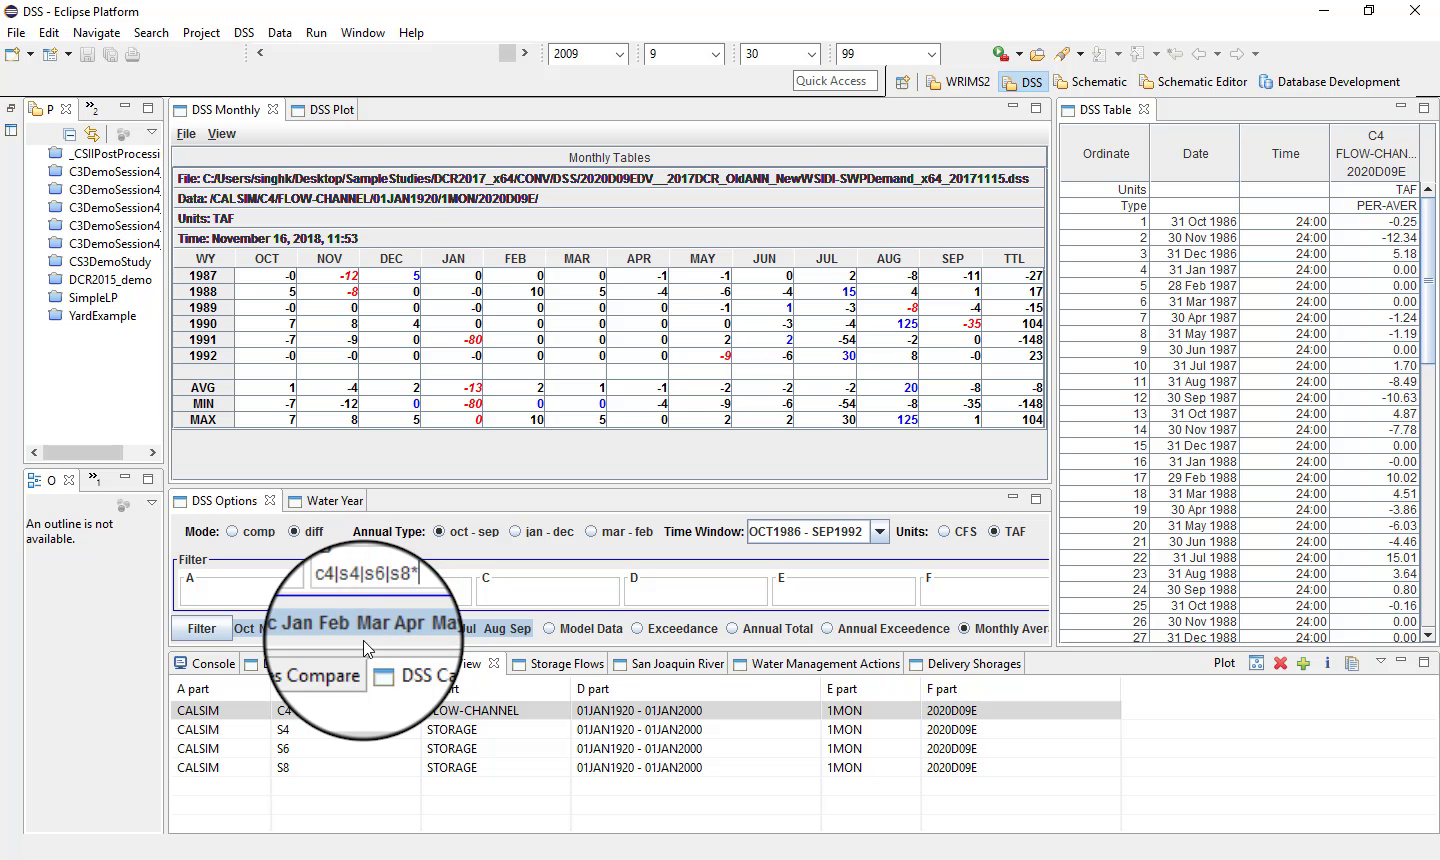
Multiple-variable filter operators
The filter field also supports:
vertical bar operators for multiple variables;
wildcard patterns such as
*.
Water year type caution
Use preloaded water-type information carefully, especially for climate-change scenario comparisons, because the built-in water-year typing may reflect existing climate conditions rather than the scenario being analyzed.
Notes
Difference view is typically shown as alternative - base.
Use caution with built-in water-year typing when analyzing climate-change scenarios or other nonstandard contexts.
Related sections